Fungarium-Terrarium
Overview
A set of equally equipped terrariums will be constructed with a set of sensors for monitoring the transformation and the effects that mycelium blocks have in the soil composition. The project is a direct interjection of Biology, IoT and Environmental fields as well as to serve as an educational project.
This project will allow an involvement and collaboration across several of the workshops in ZAM such as
- Electronics
- IoT
- Bio-lab
- Media
- Art-Design
Goals
- To monitor the degradation of the mycelium block along with the effect on soil humidity and composting.
- The collaboration of the mentioned fields will create an interactive platform for monitoring in real time the procedure
- The results obtained will serve to strongly support the usage of compostable materials in consumer markets.
- Publish our data formally and delivering a trusted experiment with collaborative open science initiative
Specifications
The beginning of the projects starts by building 3 terrariums and looking at the available volume. The conditioning of the terrariums has to be equal:
- Volume
- Air exchange rate
- Water input
- Soil
- Type and size of plants
- Variety and amount of insects
- Light
Monitoring
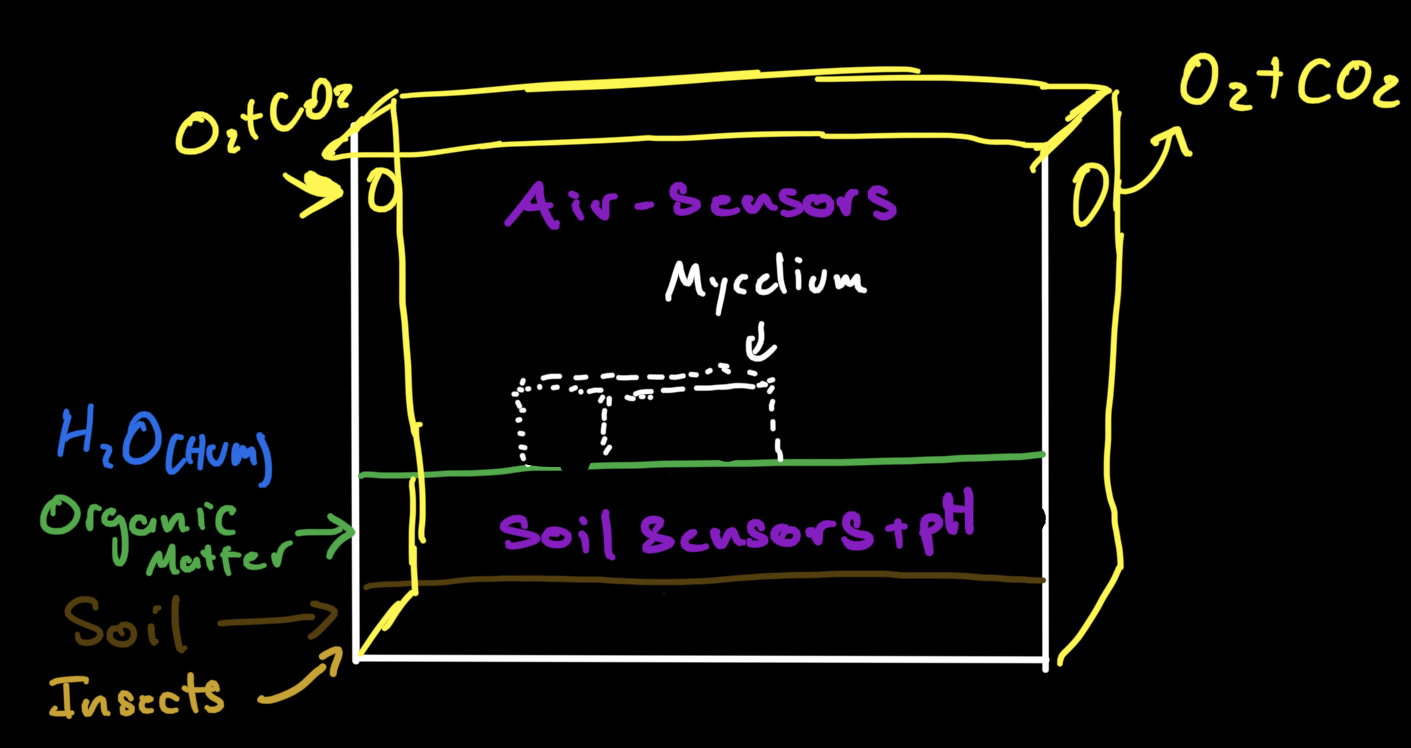
The monitoring of the decomposition of the mycelium will be done optically using a camera. In the case of the effects that it has on the soil, those will be correlated to the concentration of different gasses in the atmosphere (air) and within the soil (buried). It is important to monitor consistently and to keep transparency in the handling of the data. We will specifically monitor the following:
- CO2 ppm
- CO ppm
- CH4 ppm
- Volatile organic gasses (VOGs) ppm
- Relative Humidity
- Temperature
- pH of soil
The data acquisition will be hourly and for as long as the mycelium block takes to become compost (200 days perhaps).
Conditions
In order to emulate as much as possible the conditions outside, a set of fans will keep the air flow and humidity controlled. Likewise, the amount of water spayed weekly will be controlled.
The Baseline scenario: Has no mycelium in it and it allows us to see the current status of soil.
The Soil-Enhancing scenario: The mycelium is intentionally spread across a surface with the intention of using its properties to enhance the soil
The Trashed scenario: The mycelium is left there without an intentional purpose, it hopes to emulate a leftover package.
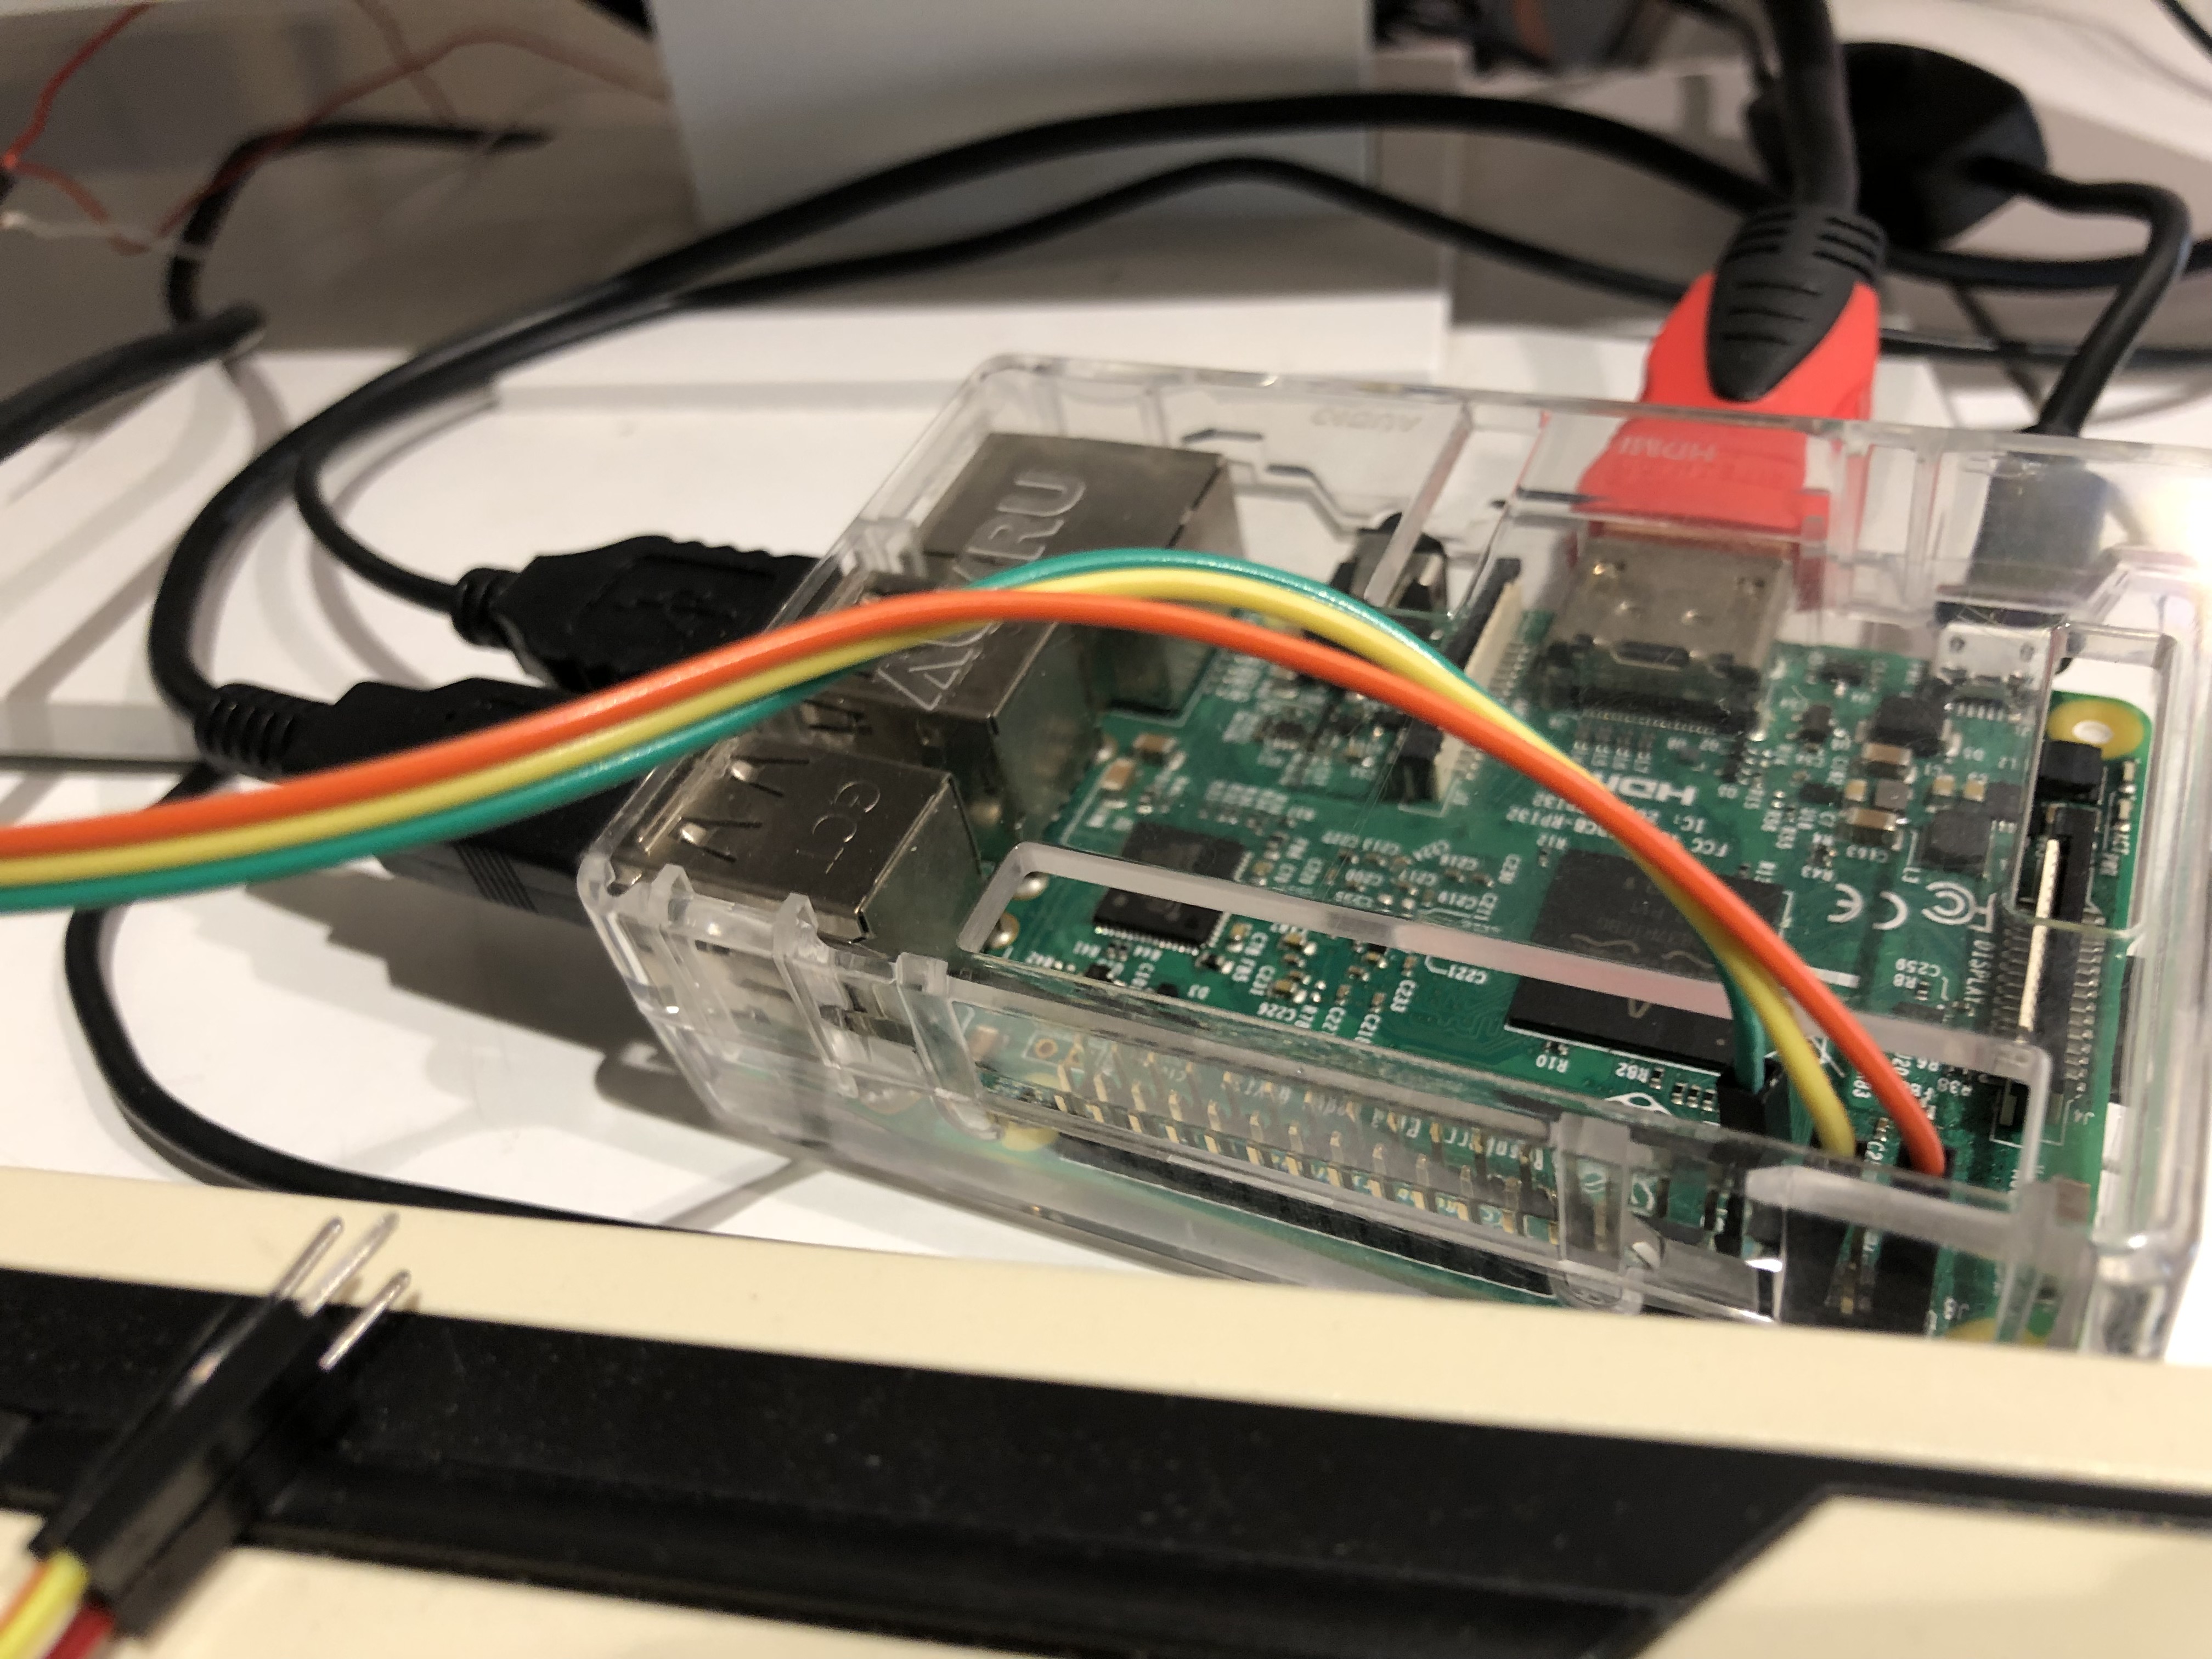
Raspberry pi Interphase
This IoT section of the project is the most exciting.
The interphase will serve for the following purposes:
- Control and distribute power for the sensors and motors
- Transform electrical impulses from sensors into digital data
- Detect, collect, store and analyze data
- The data will be analyzed in an educational fashion in the fields of IoT, Biology and Environmental Science in the form of an online dashboard
- Data will be stored and made public
Work Breakdown Structure
The project is broken in 3 main section which can run simultaneously and culminate in a final build-up-deploy day:
- Construction / Conditioning
- Glass-made terrarium
- Holes or ventilators with cabling for power
- Placement on a selected window
- Monitoring / Collecting
- Sensor placement and detection
- Temp and humidity conditioning (3)
- Data collection and storing
- Analysis / Publishing
- Analyze data and explain findings
- Create interface for reporting
- Deploy repository and web-based dashboard
- Write article for media and for open science publishing
Milestones
Construction & Conditioning
Well sealed and safely positioned and secured in a window with a display for the street.
Stabilization of same temperature and humidity in the 3 terrariums
Monitoring & Collecting
Detection from all sensors and cameras with a hourly rate
Collecting and storing in SD cards and upload to repository
Analysis and Publishing
Creation of an interactive dashboard which receives real time data and presents graphed values along with their explanation in the biological sense all culminating in a web-accessible dashboard
Event for live streaming of projects and media events, writing open science publication for teaching and research journals.
Participation
Look at the teams and projects
Everyone is welcomed in more than team
Test new fields
Learn and teach
Join the sub_groups
Each group can communicate internally as they prefer
A main repository for the project and ‘official’ sub-projects will be created
Have fun, create, report the funny moments and the great work
Main project meetings
On selected dates the representatives will gather and assemble the main project.
There will be a celebration of Min 1 broadcast

Join Us!
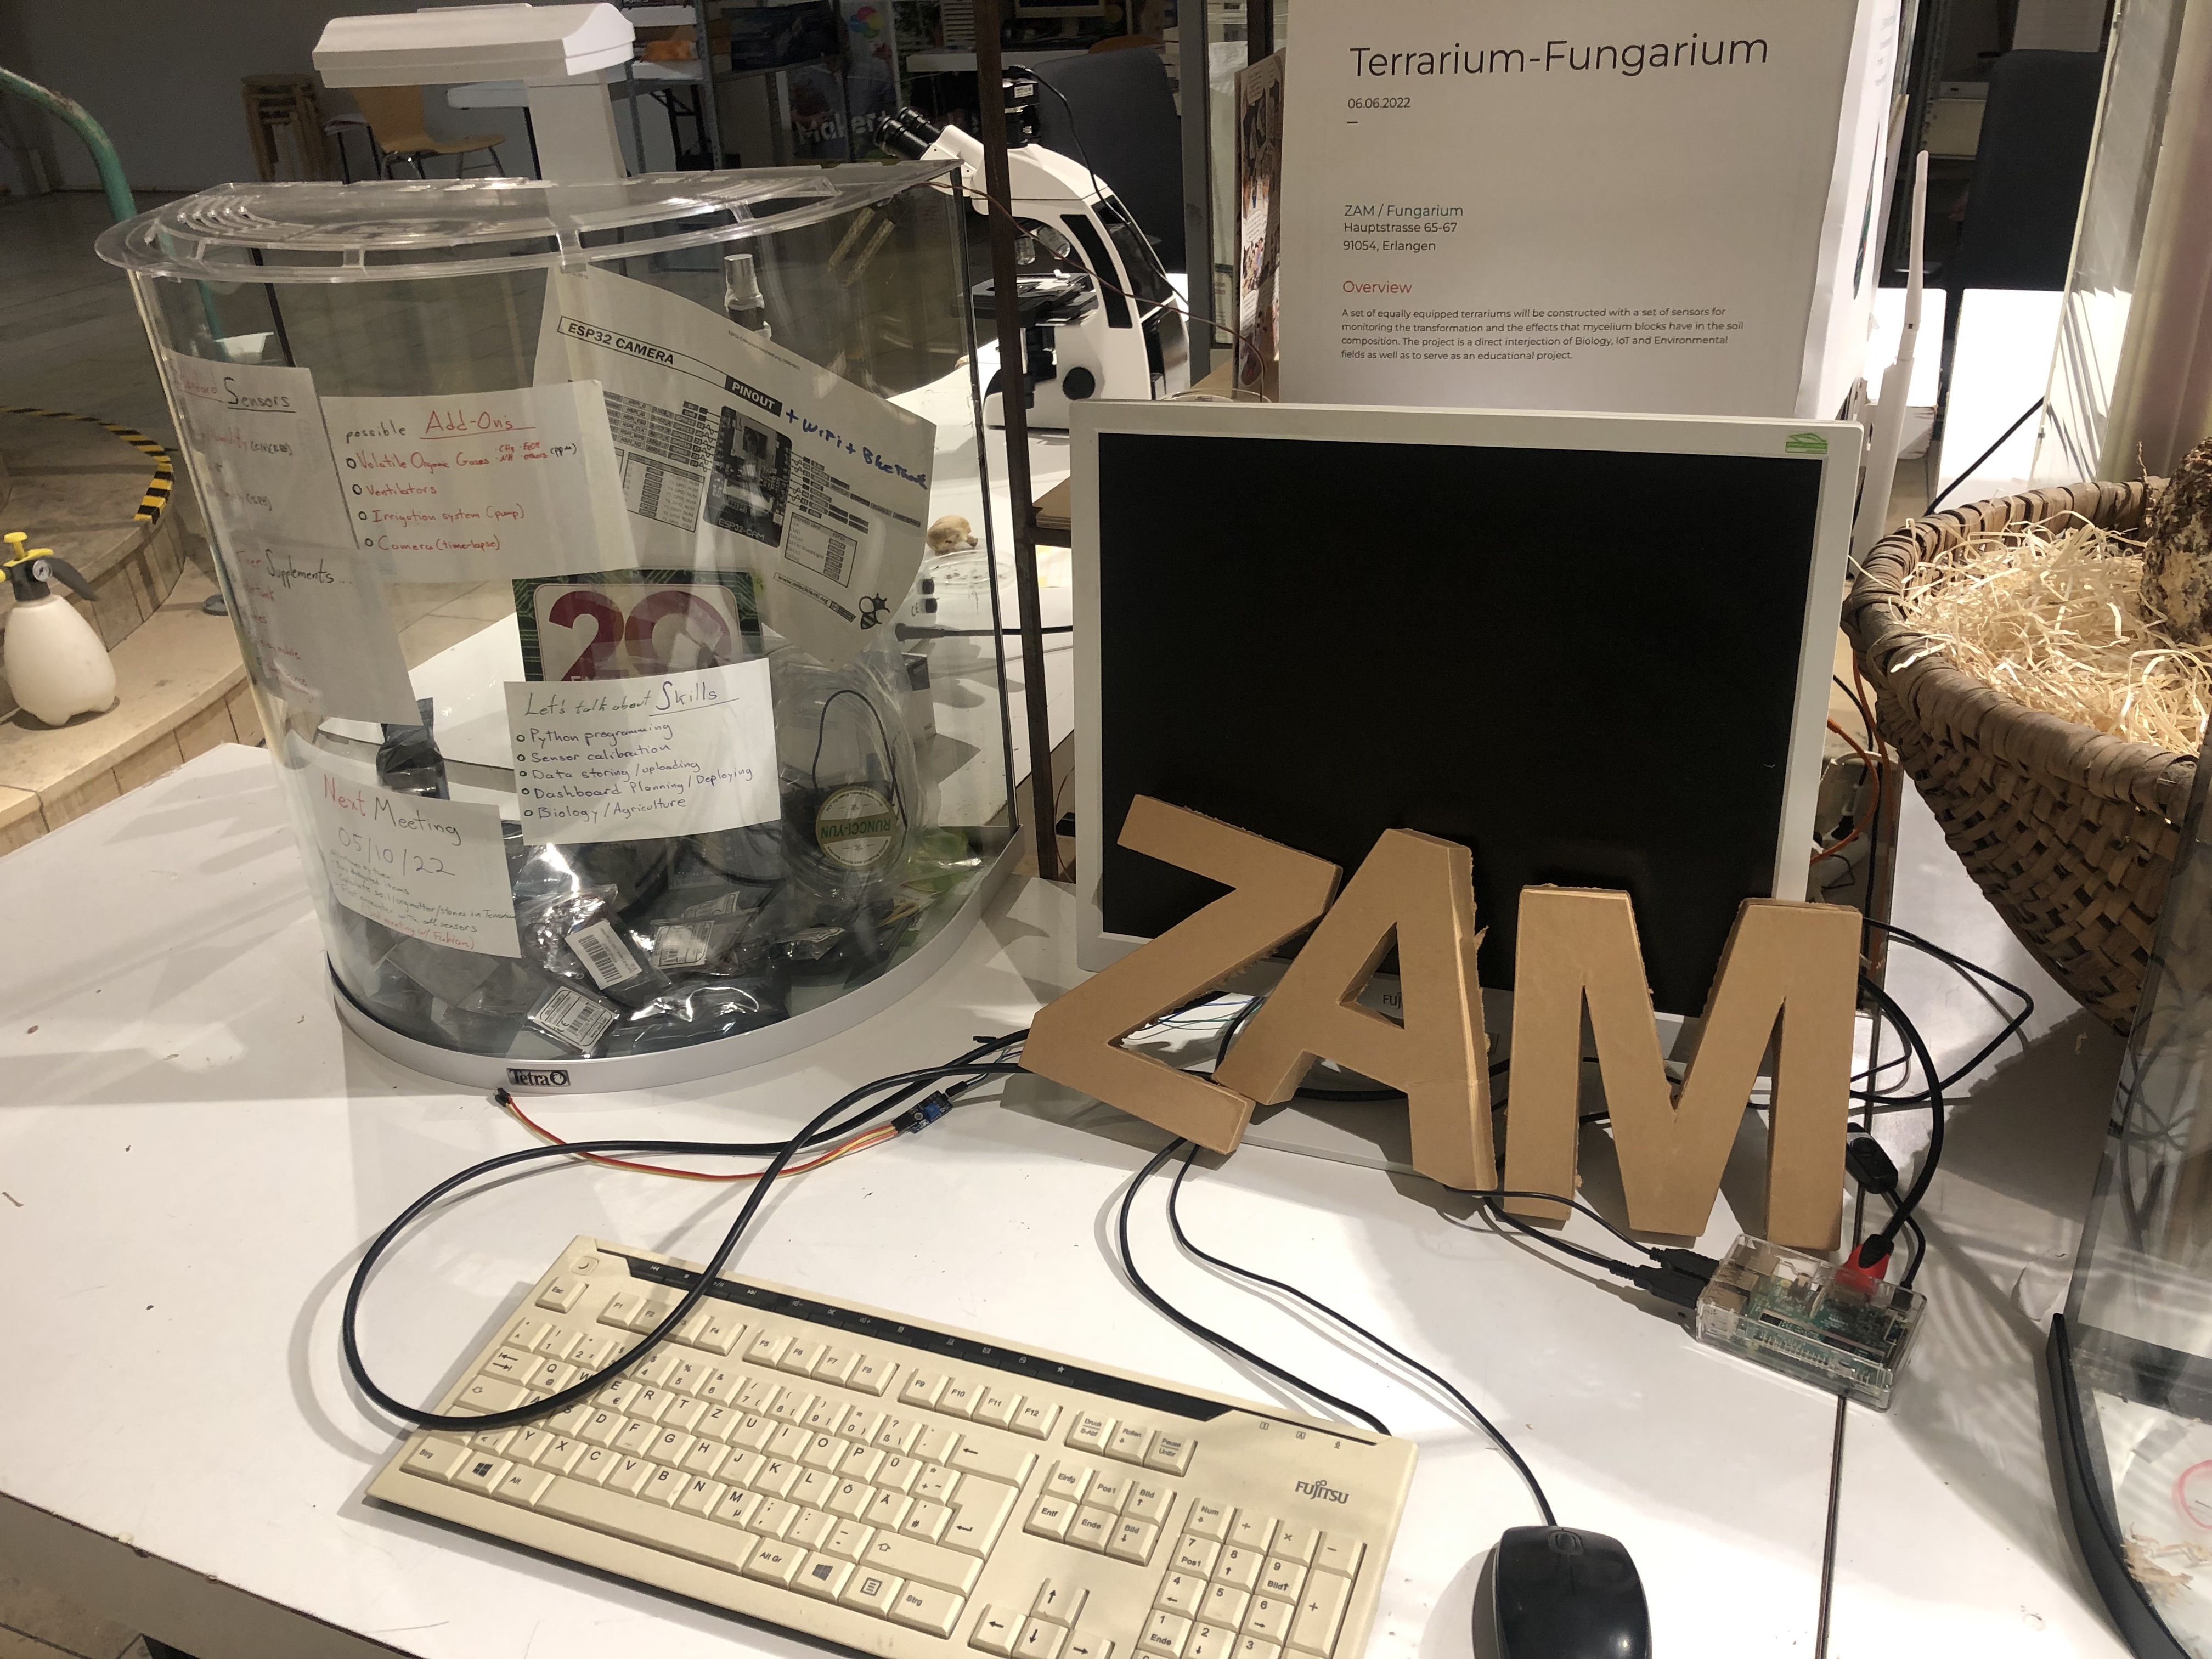
Update 19.09.2022
We are BACK!!!!
We want to thank first of all to the PCS project initiative for providing a jump-start funds and moral support to continue this project.
![]()
This projects intends to show the potential of ZAM and the Fungarium from several perspectives and it aims to be a corner stone of future projects.
It is time time to meet and greet.
On Wednesday 21 of September at 16:00 hrs at ZAM we will hold our first introductory meeting, do not worry, we will have more introductory meetings in the future.
Outline:
-
Team Introduction
-
Project description
-
Budget and limitations
-
Timeline and objectives
-
Brainstorming solutions and ideas
-
Objectives for next meeting
We are always looking for contributions from all sorts. If this inspires you let us know how.
In this project, education, design ,art and sustainable values are mixed with technical skills, IoT set-ups and aims to introduce open-source data for others to use.
See you soon!!
Takes from the last meeting:
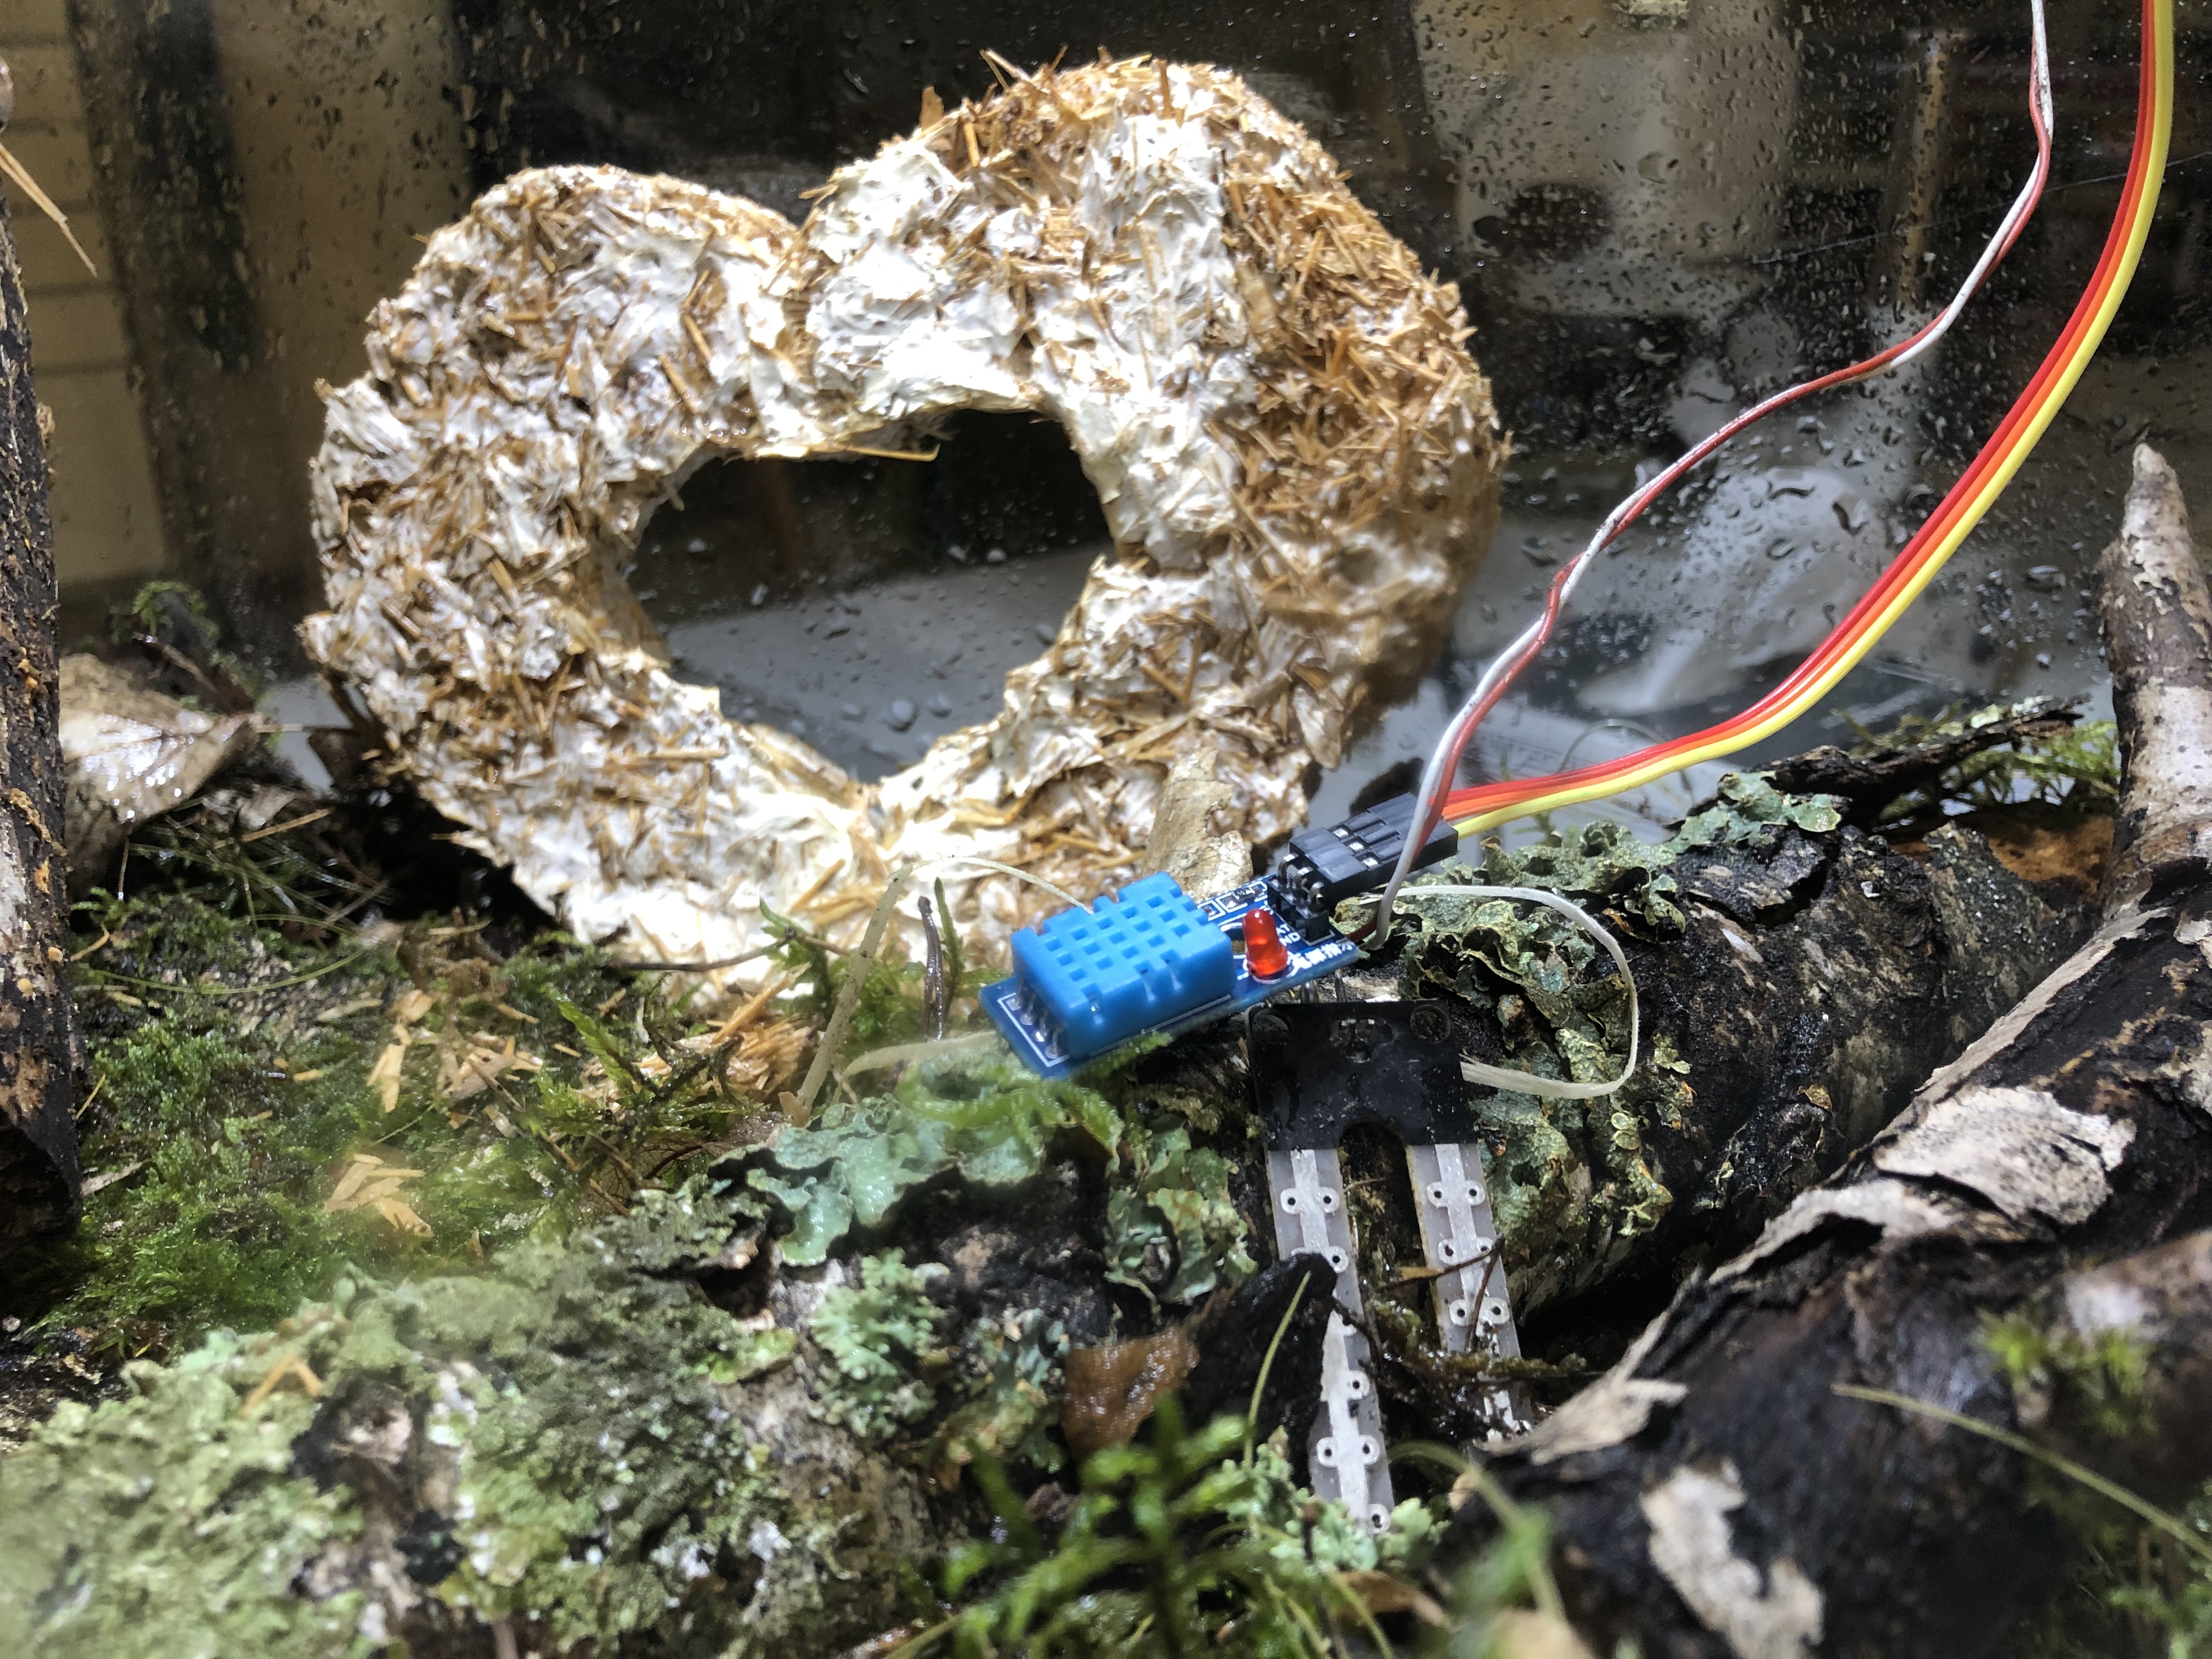
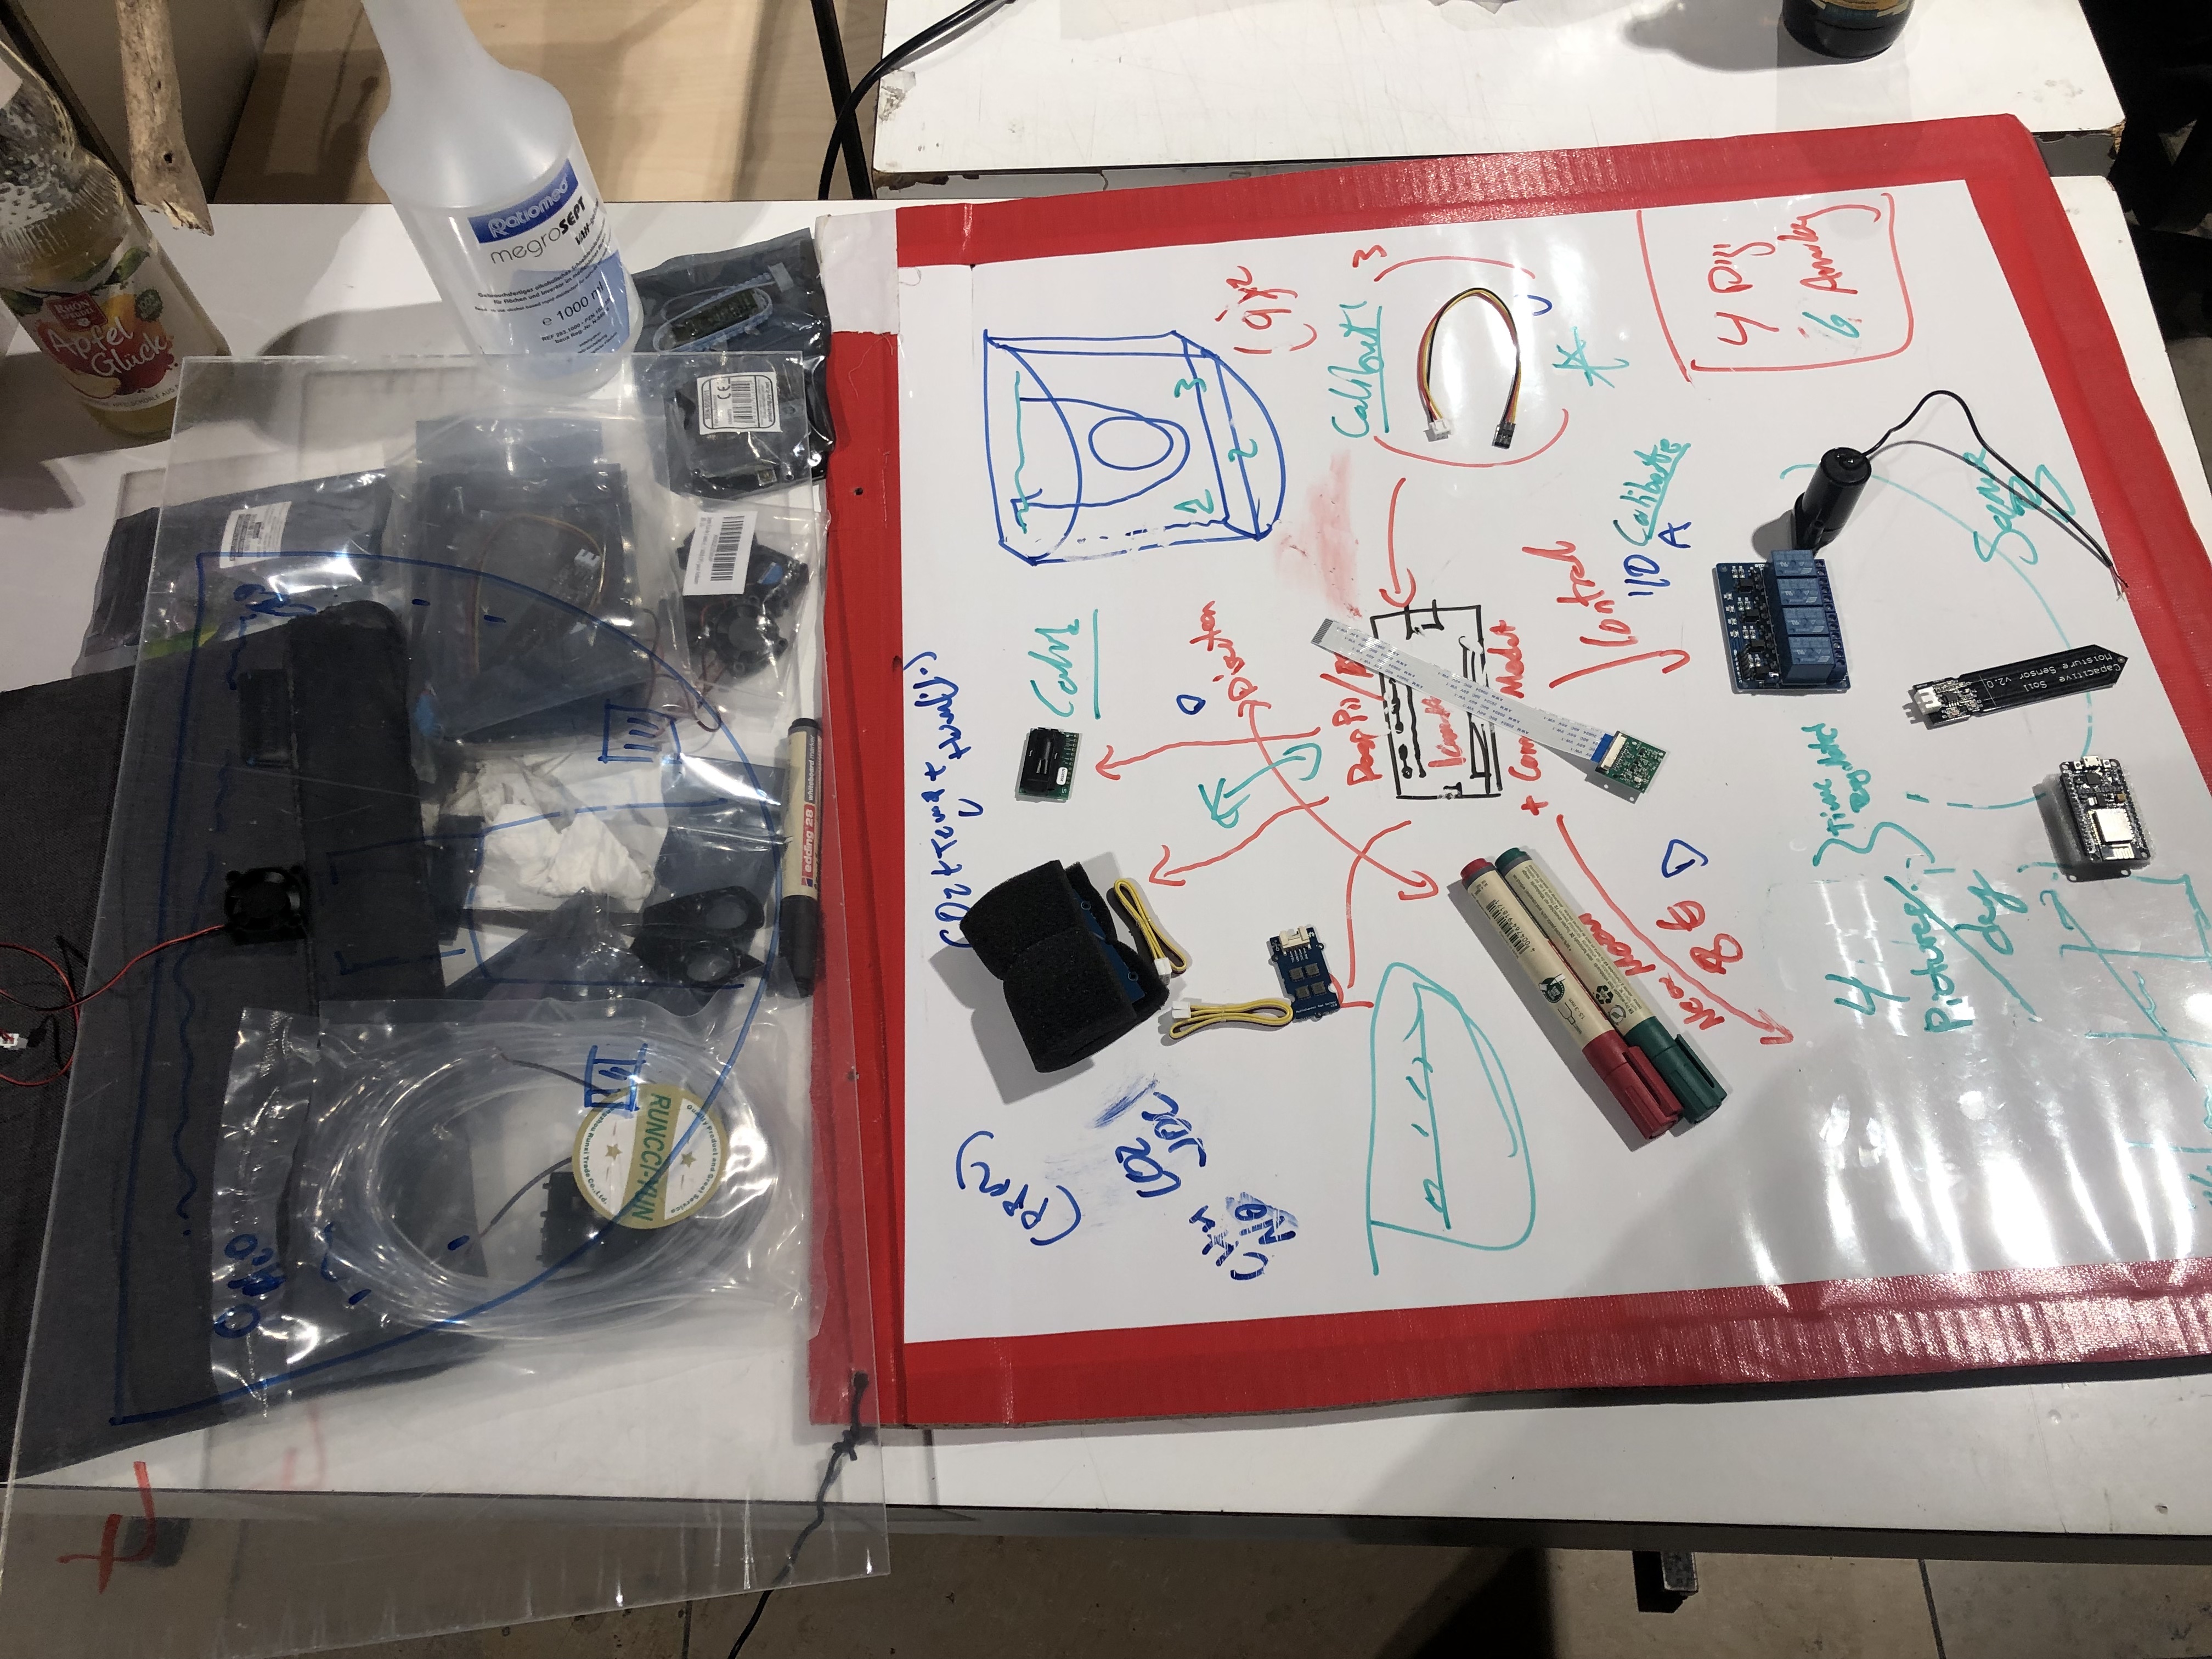
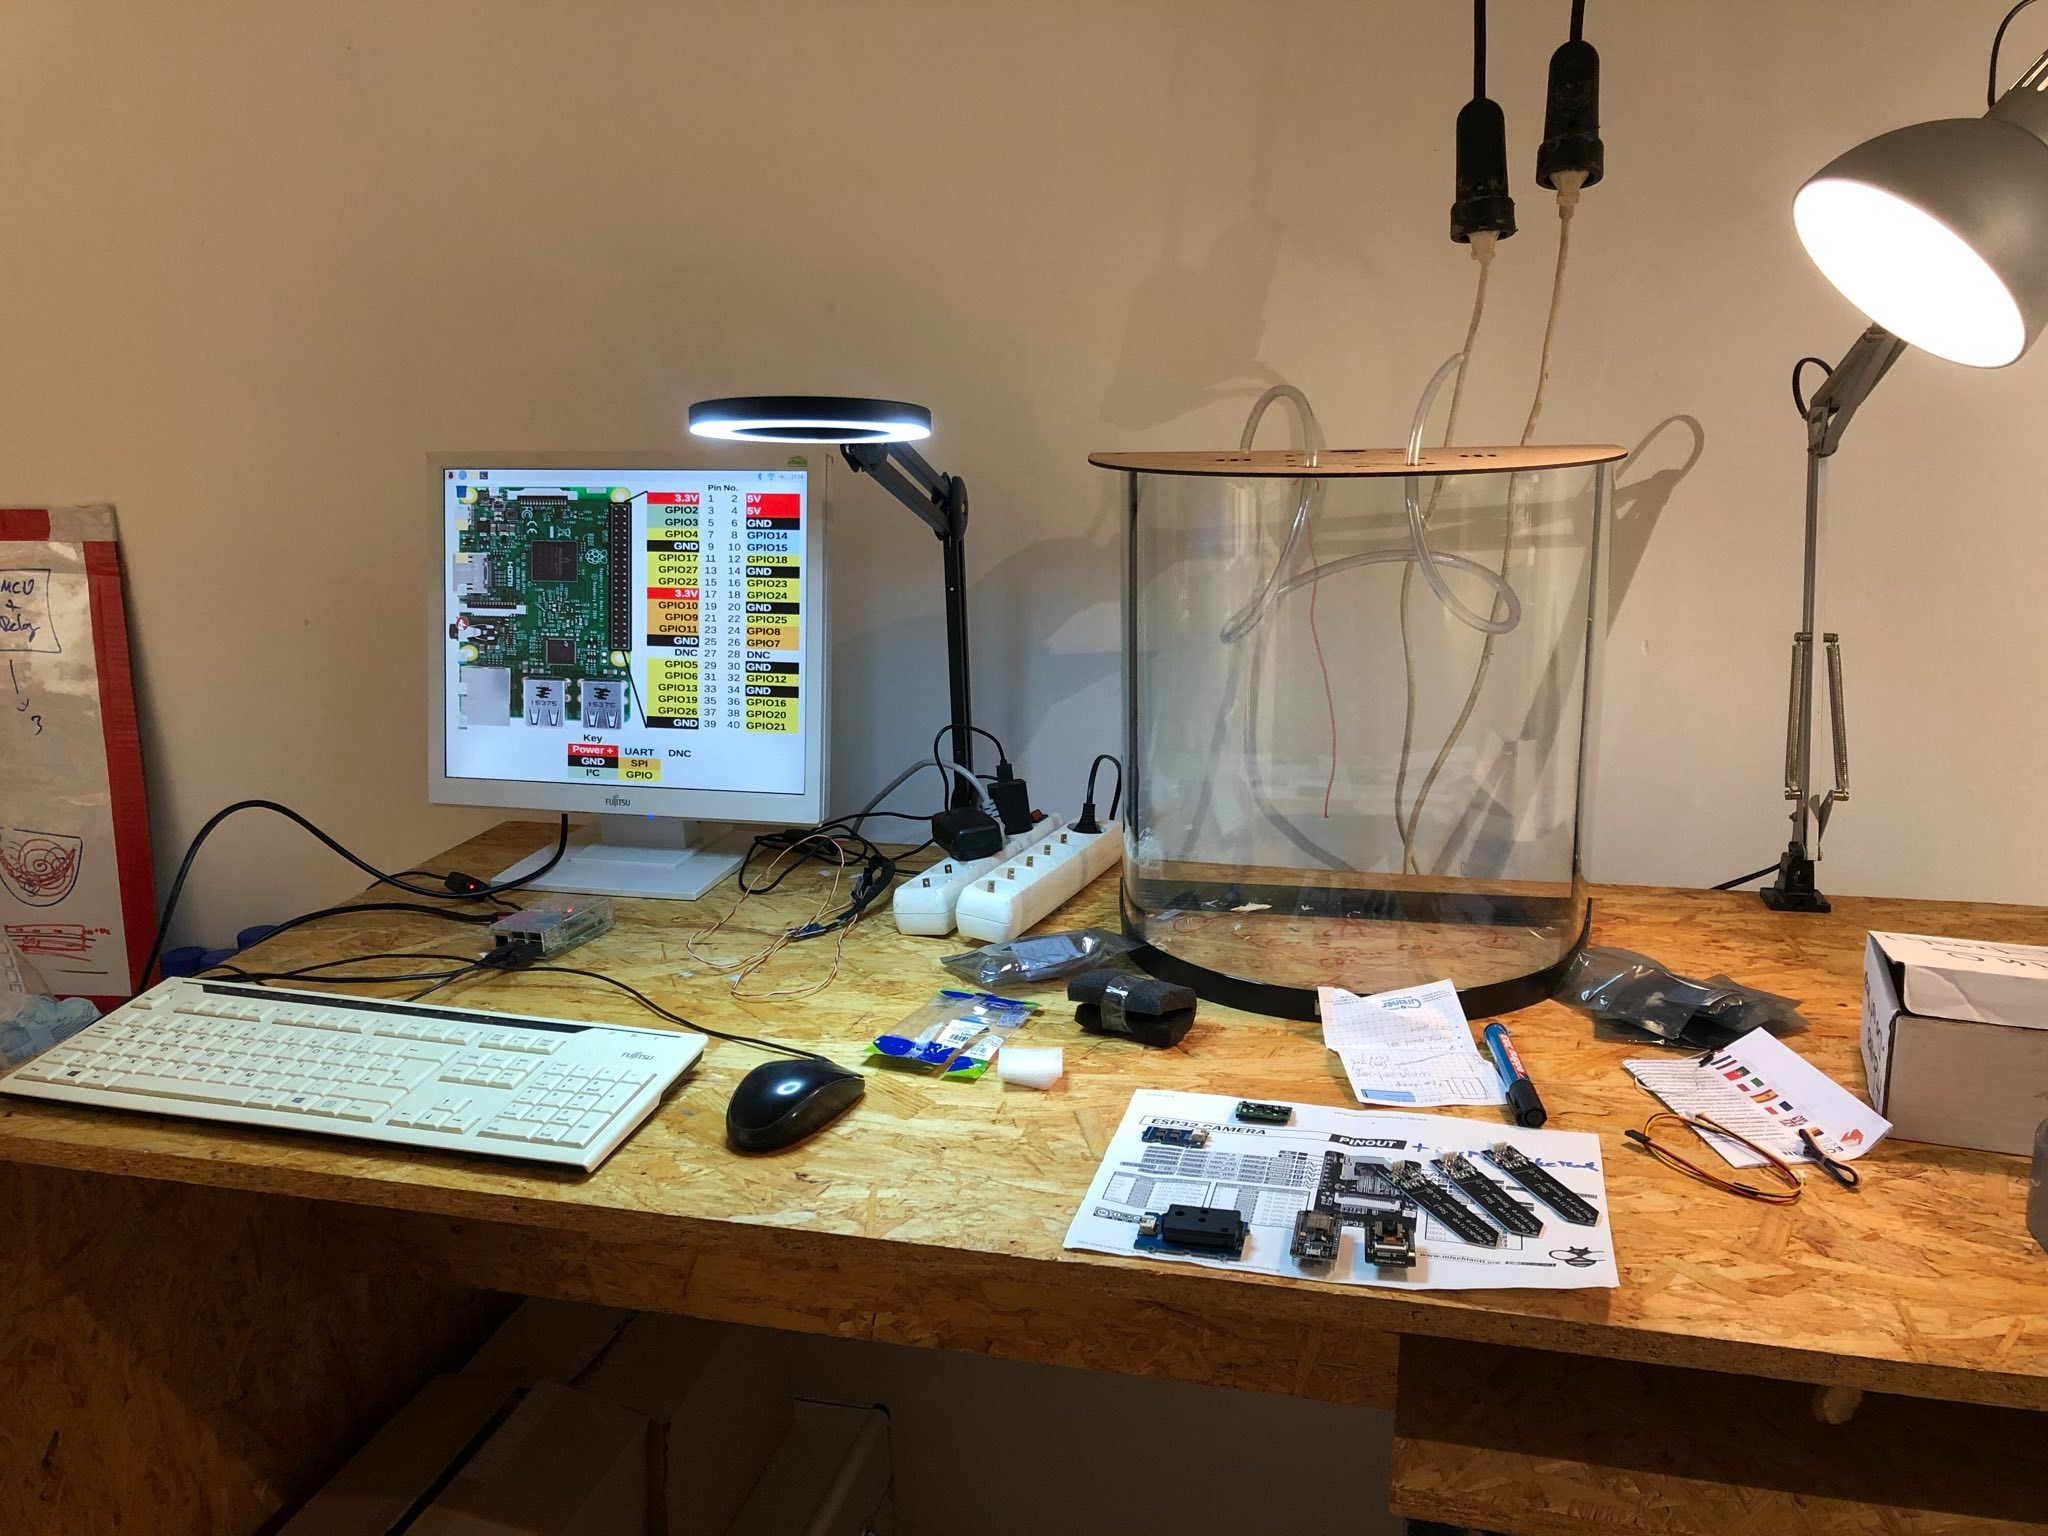
- Creation of a prototype
- We add the sensors first together, in an empty terrarium.
- We discuss the position of the sensors and define the distances.
- Planning together the top of the terrarium which should hold the camera, the Pi, and other things
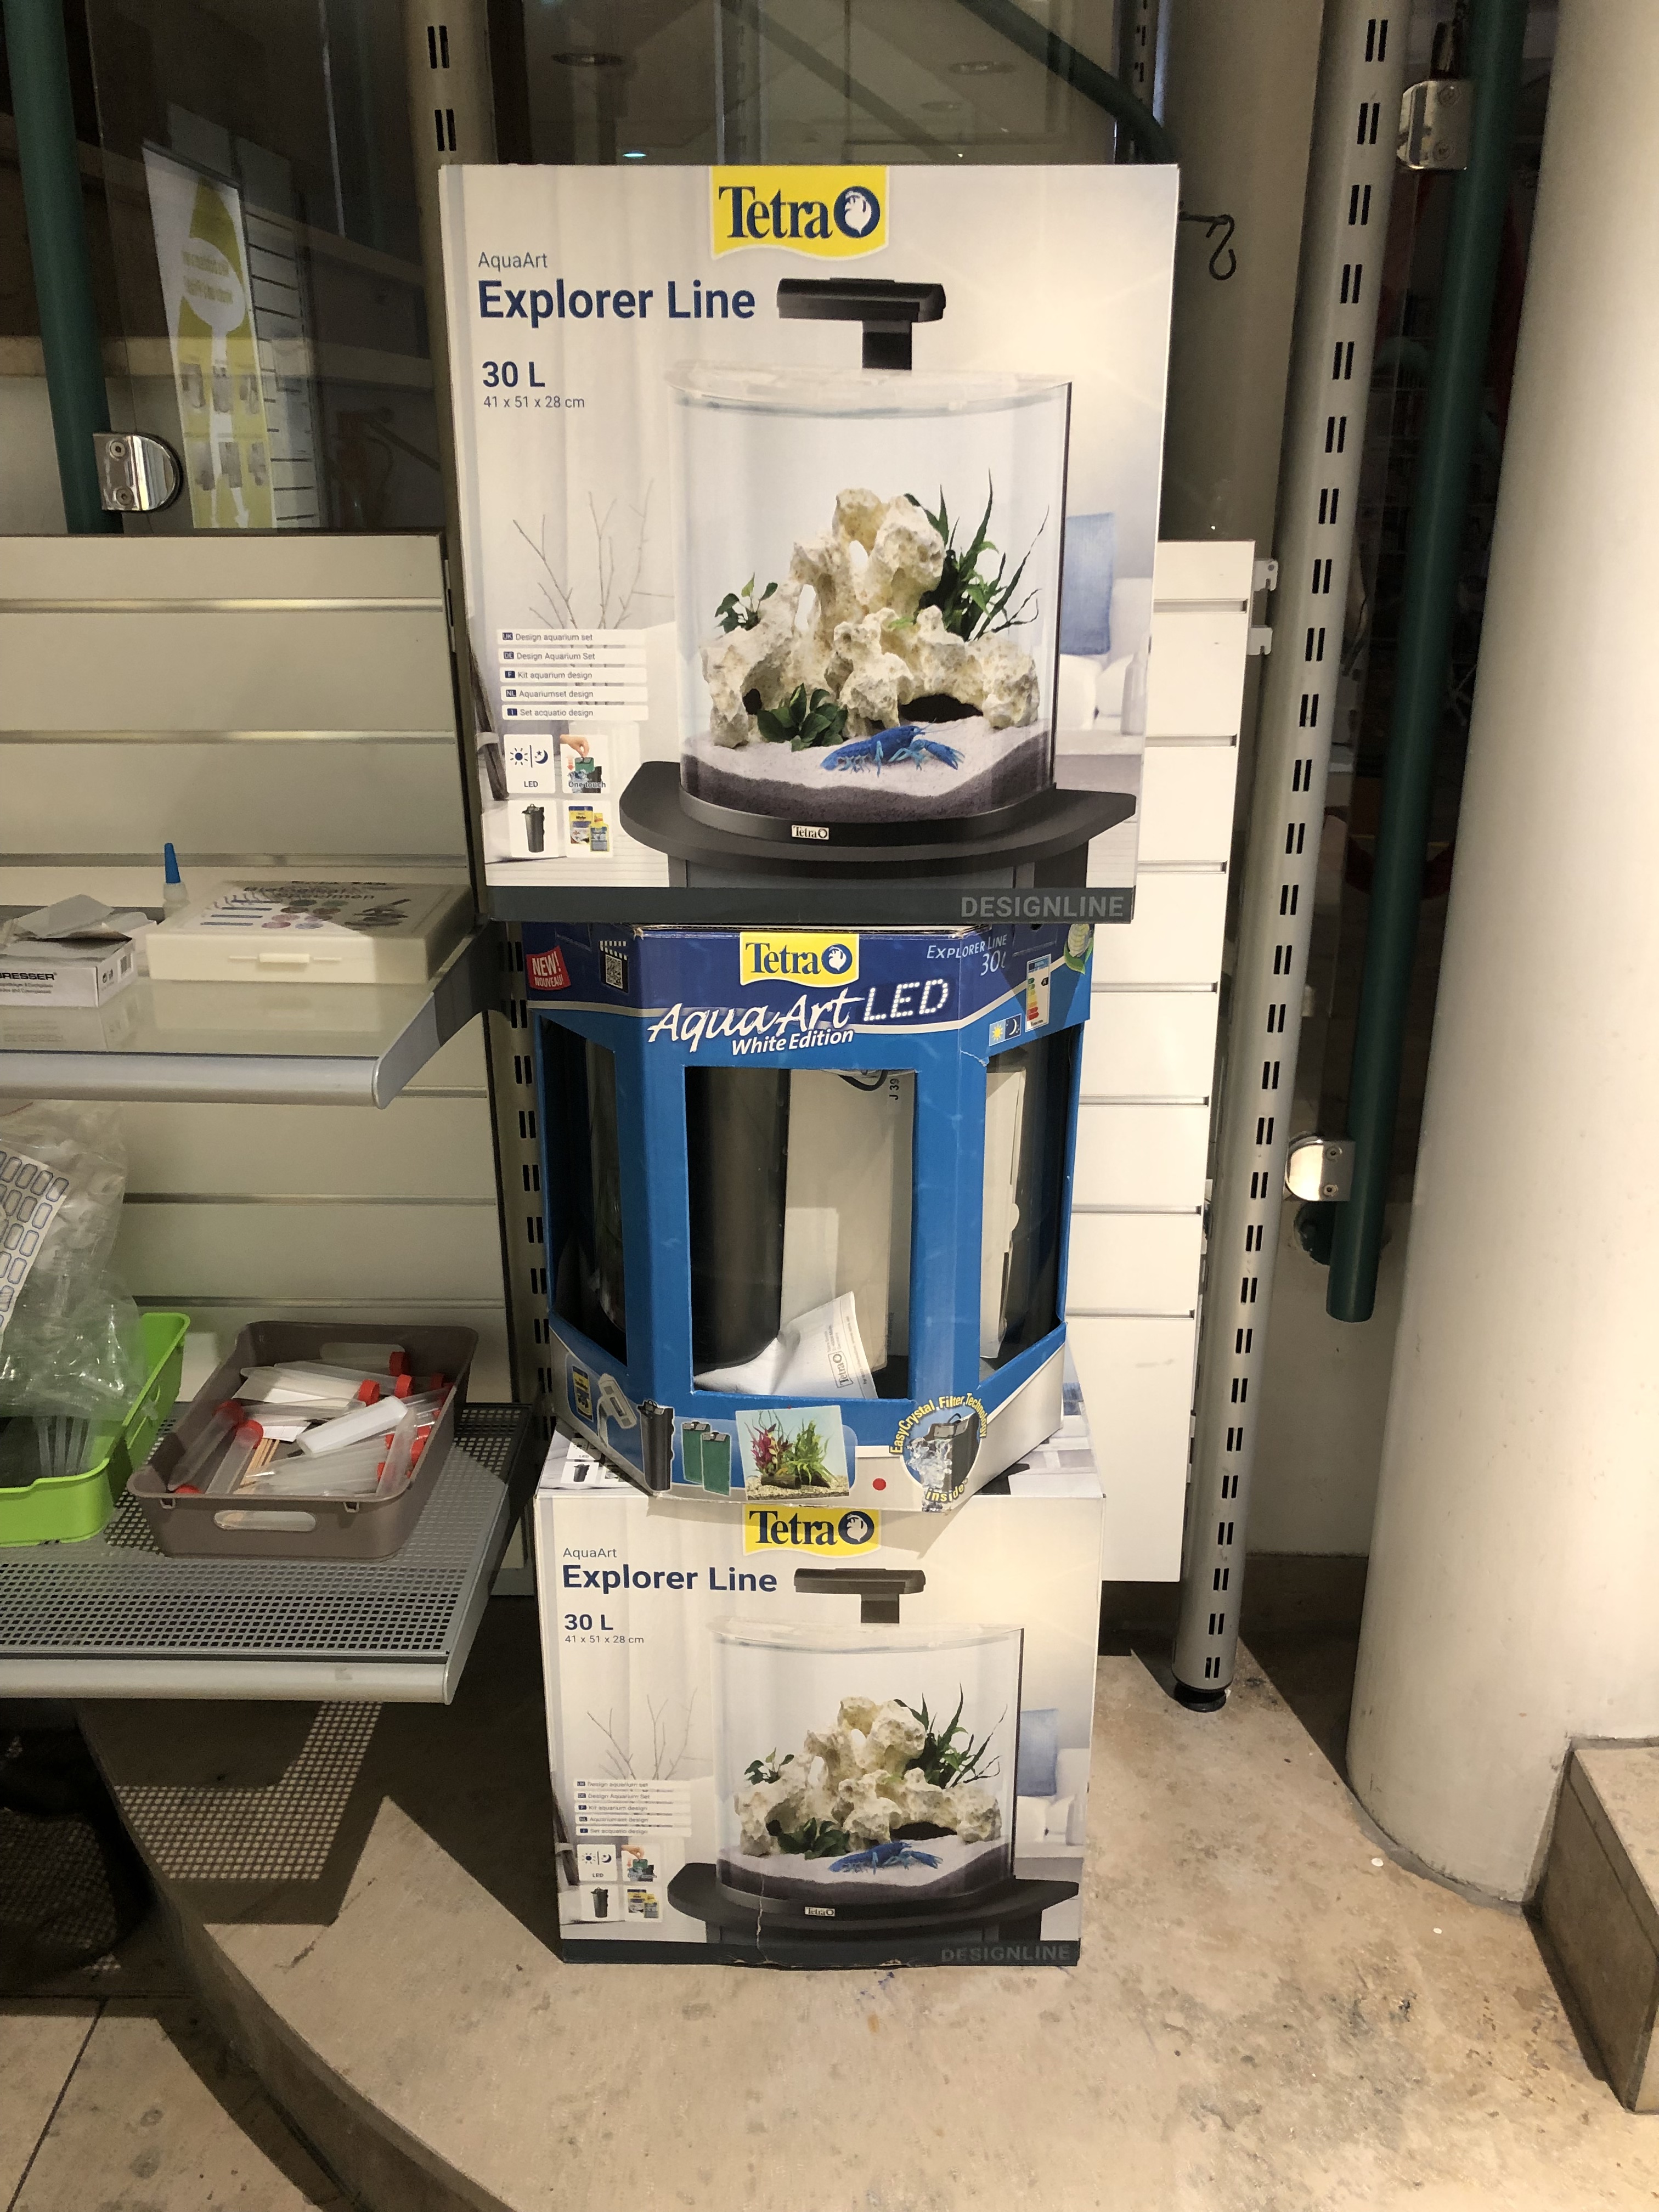
- The Terrarium:
- 30 L
- Has a light module we could use, perhaps.
- The lid has to be modified or totally design for our purposes
- The sensors:
- Seed Studio Grove Multi-Channel Gas Sensor v2
- It can detect a variety of gases, besides Carbon monoxide (CO), Nitrogen dioxide (NO2), Ethyl alcohol(C2H5CH) and Volatile Organic Compounds (VOC, other gases)
- Seed Studio Grove SCD30
- It can detect carbon dioxide (CO2), temperature (C) and humidity (%rel)
- Capacitive-Sensing Soil Moisture Sensor
- Analog detector which uses conductivity of water in soil to measure relative humidity.
- Seed Studio Grove Multi-Channel Gas Sensor v2
- The Camera:
- Raspberry Camera Module 15 M
- Aiming for a time-lapse
- The Fan
- A small fan, actually tiny, is enough to provide a movement of air within the terrarium, ensuring the exchange of air as in open air.
- The power of the fan could be controlled
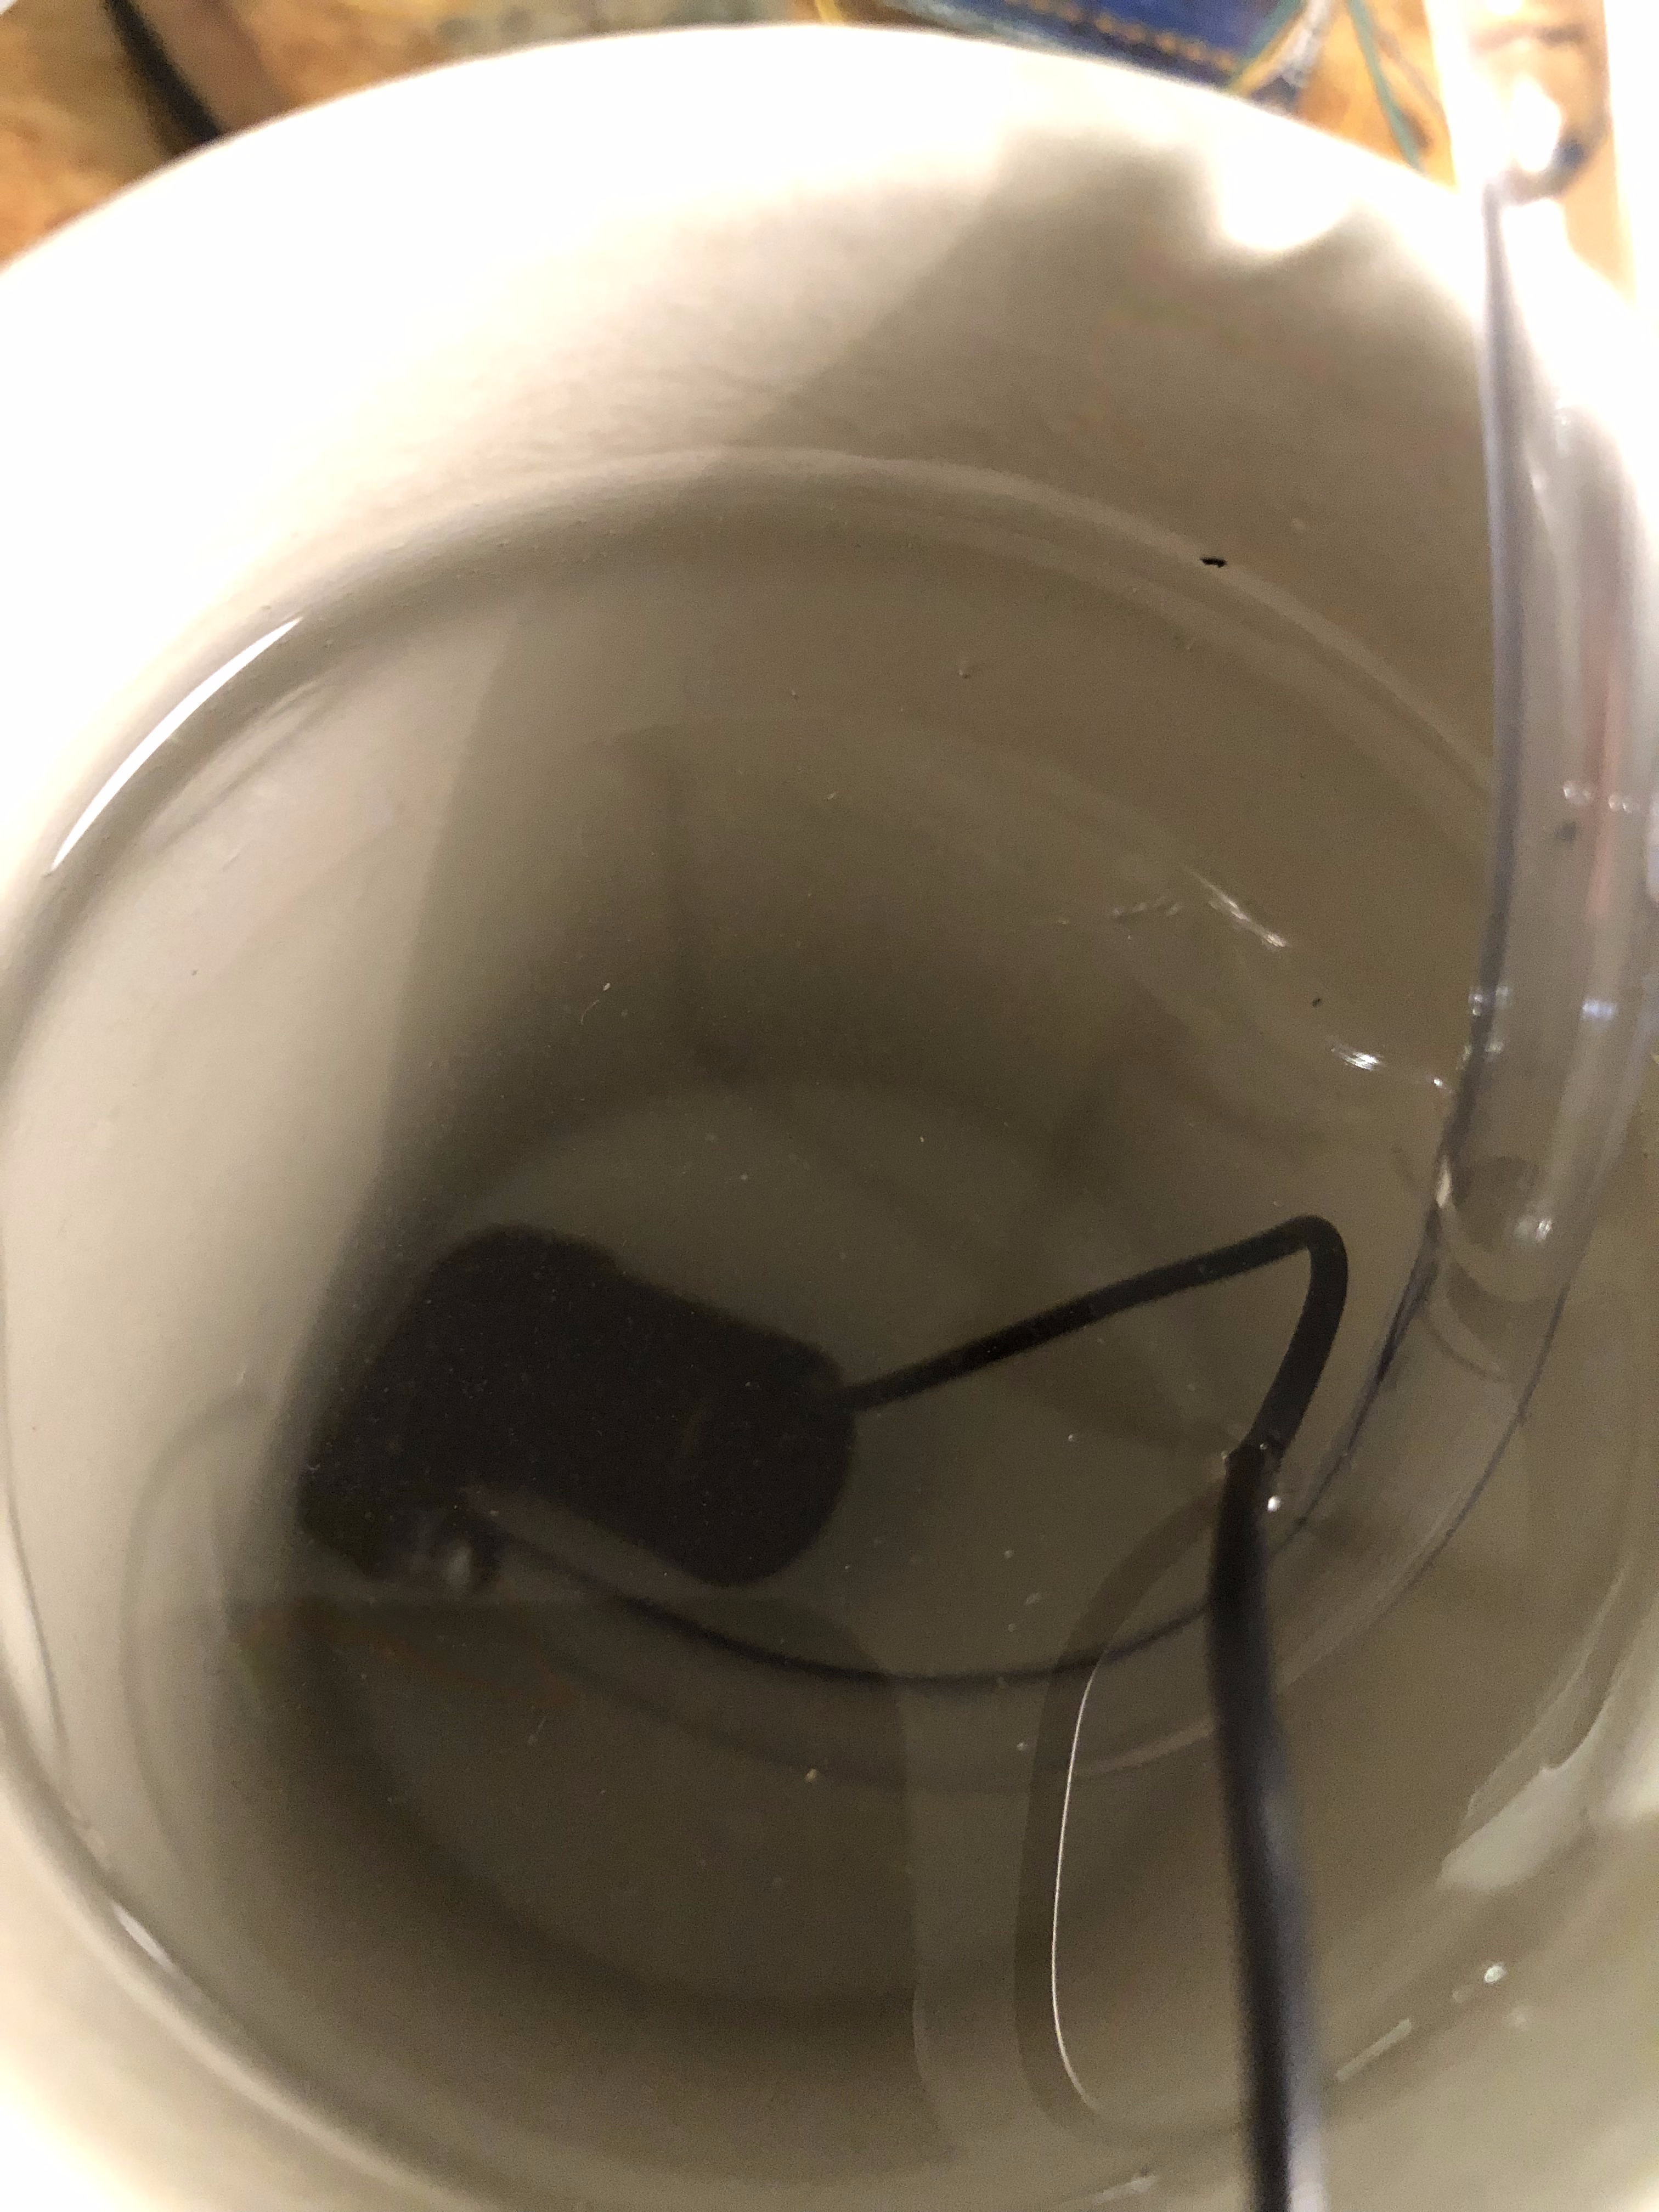
- The pump
- A submergible pump will provide water to the system
- It will be a timed used (with relay) to provide control
- Additional things to be sorted
- Relay modules
- The LID
- Cables
- Power source
- Memory
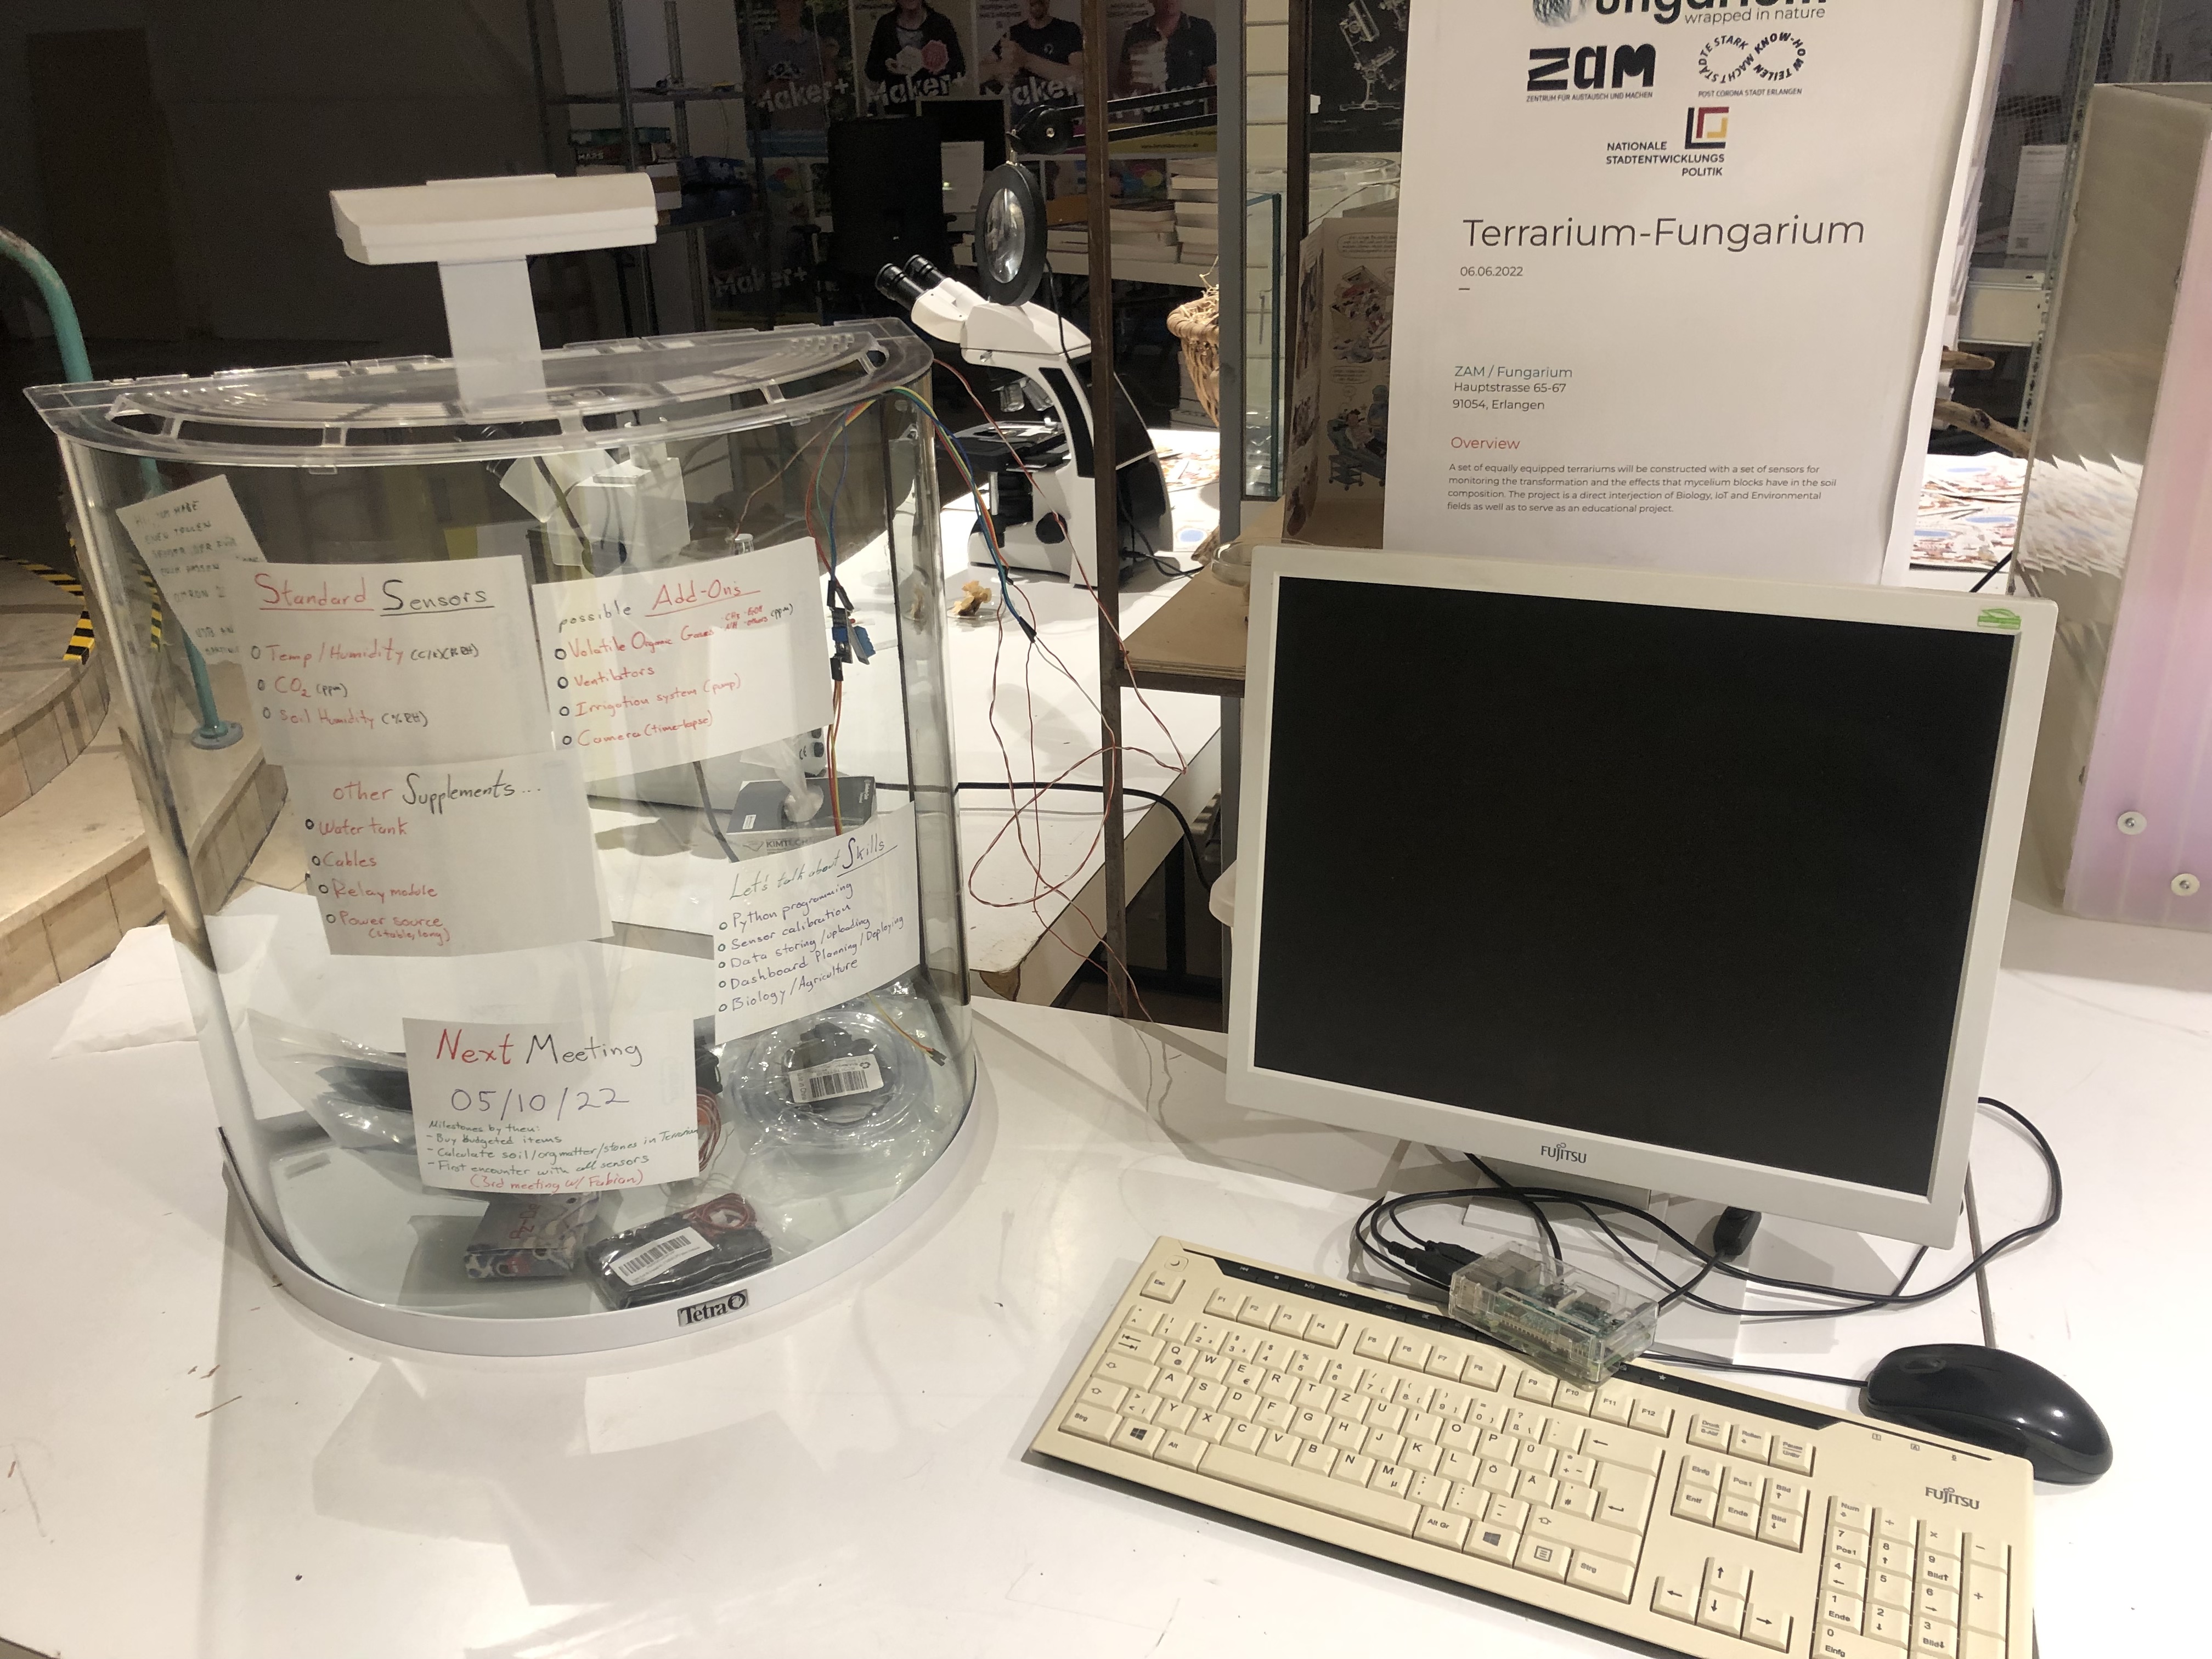

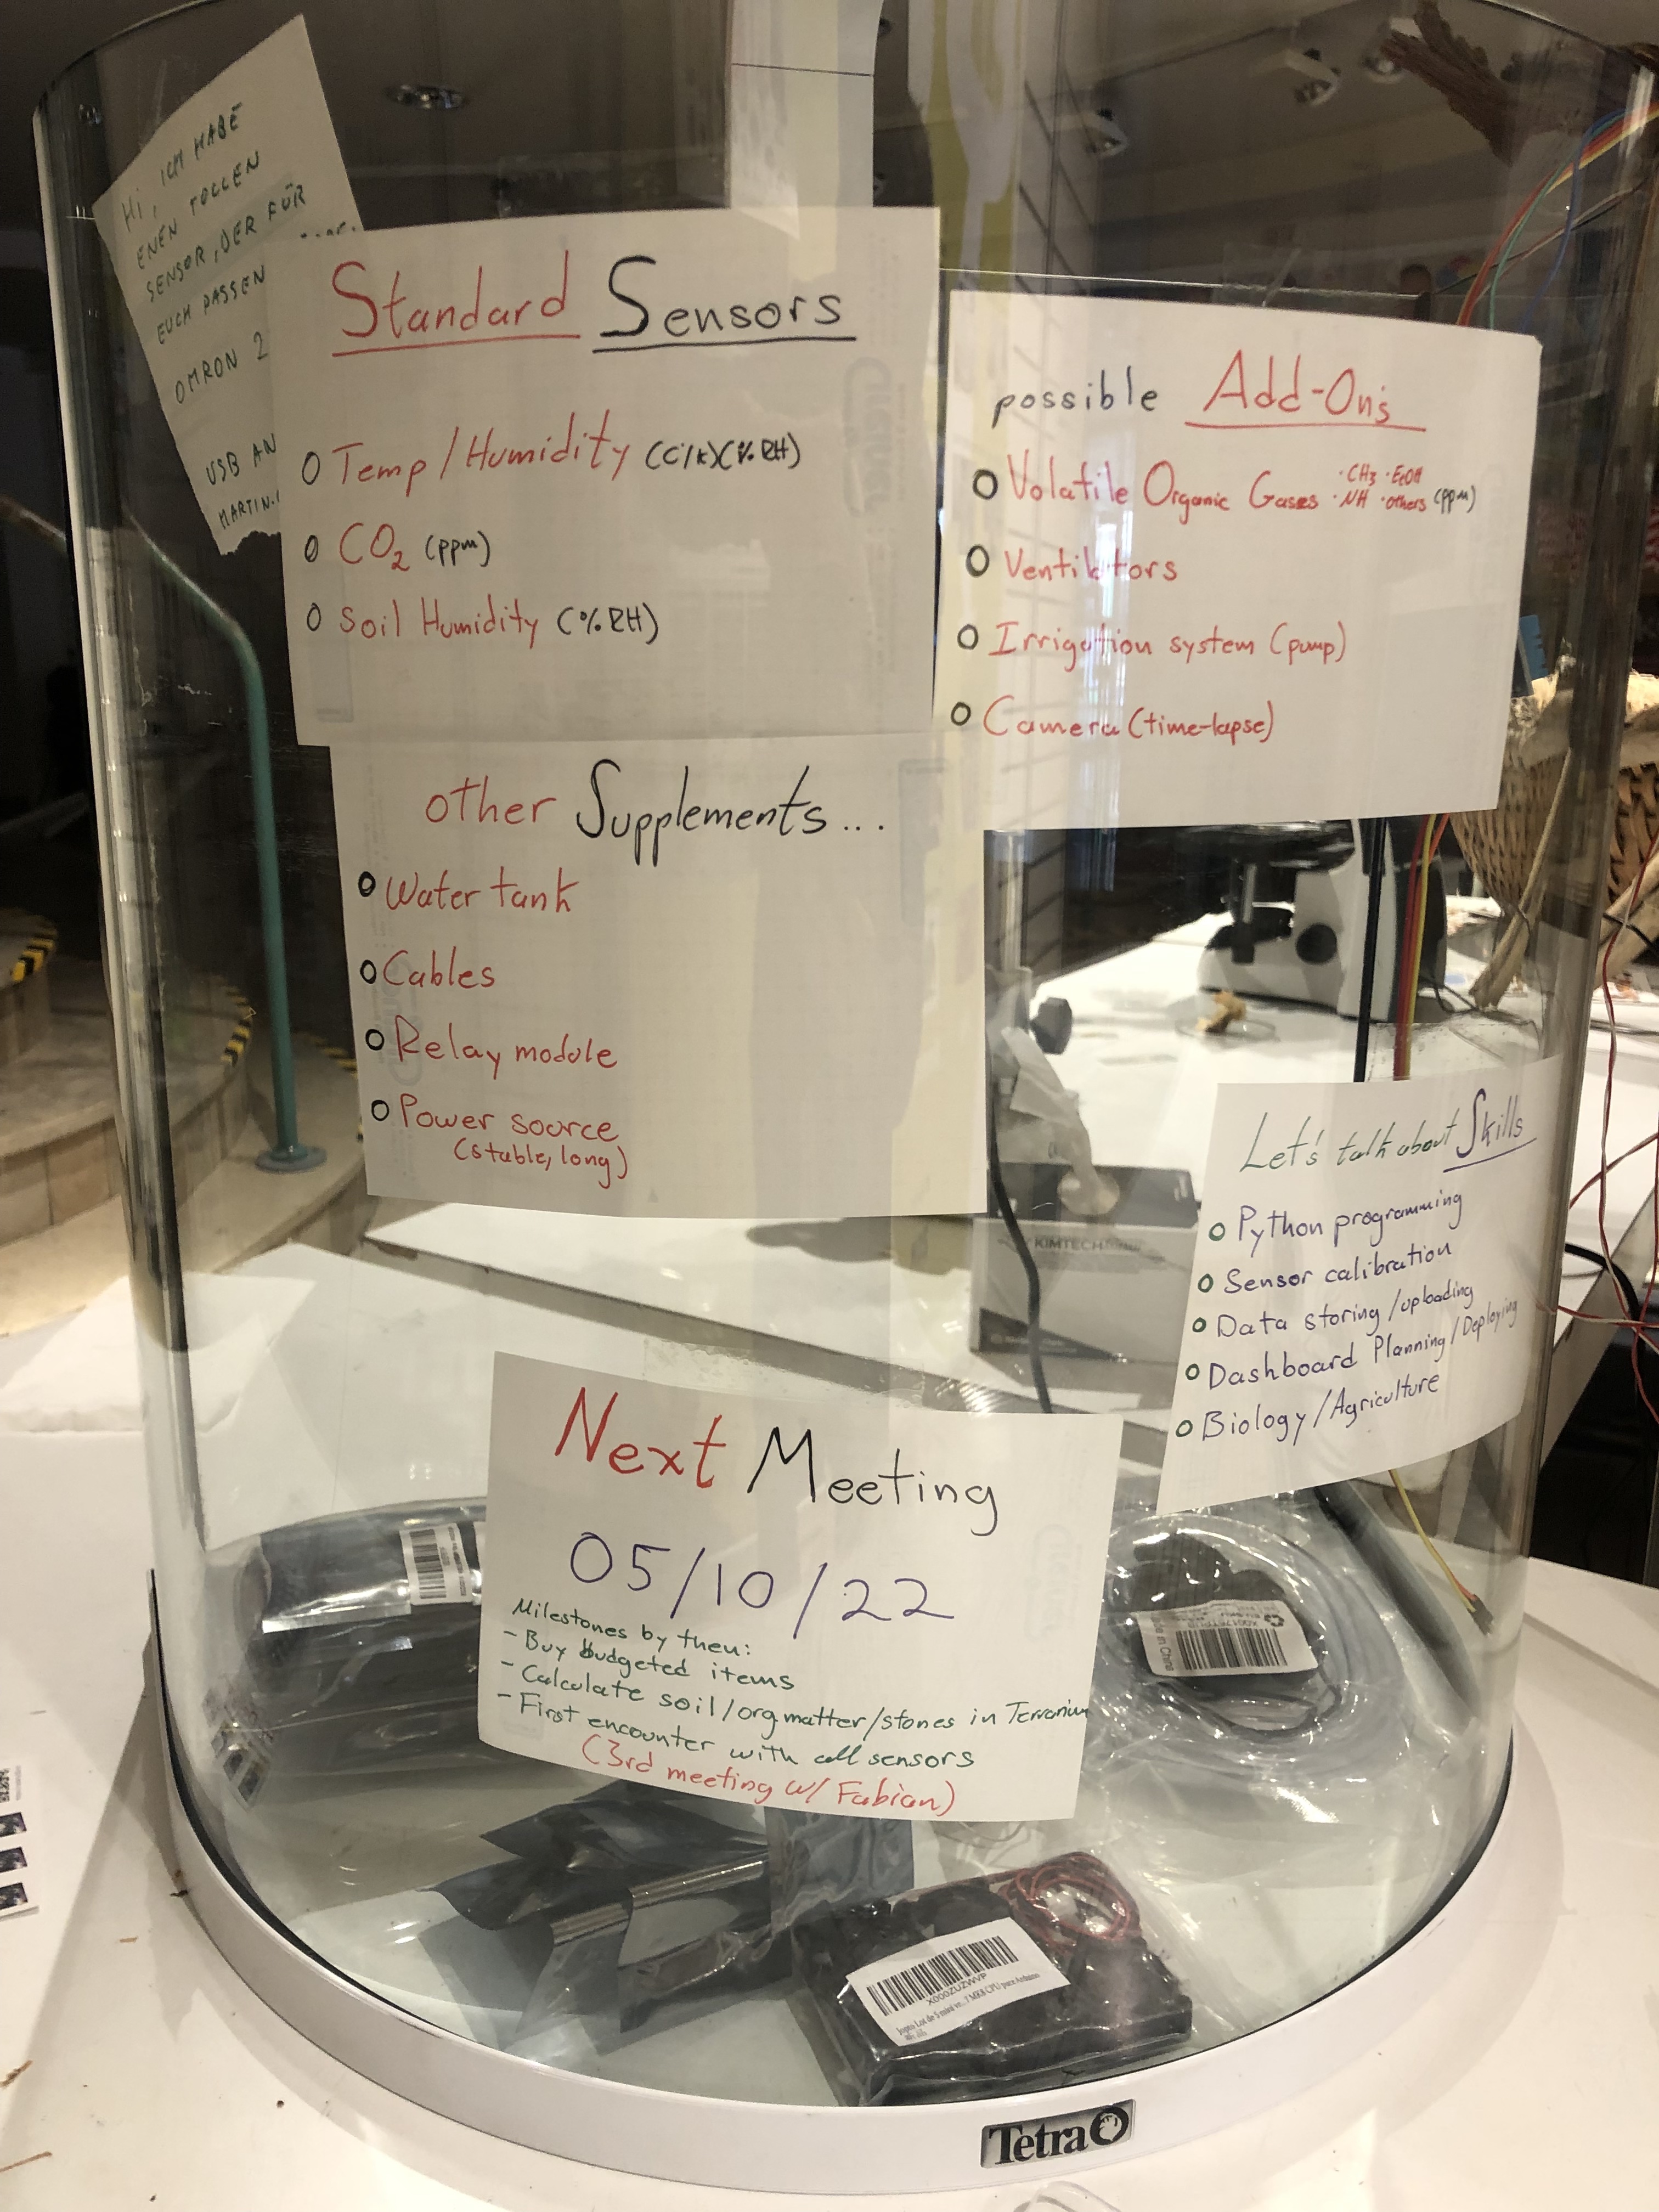
next meeting: 05 / 10 / 2022!!!
We have a new member! Jonas joined the team and he will coding with us the sensors.
There was an understanding and a clearer idea of when to perform the work as well as how to work separately.
Here are the important links for our work.
Signal group:
https://signal.group/#CjQKIGeZQSdzukw4lVI7lIGZqKntJ-PHojXPaXfQw_qaYypdEhAjQwLrDeL7gsuwKKv0JR6M
GitHub Repository
https://github.com/rubcaspac60/Fungarium-Terrarium
As we need to accommodate the information to be available for everyone, the members of the project can work on different versions and experiment freely on the codes. We can always recover the working versions and continue from where we left last week.
next meeting on 19.10.2022 18 to 21 hrs @ ZAM's Biolab.
Agenda:
- Introduction to RaspberryPi / Python / GitHub
- Connecting our main sensors.
- Energetic demands.
Takes from the last meeting 19.10.2022:
CHANGE OF PLANS!!!
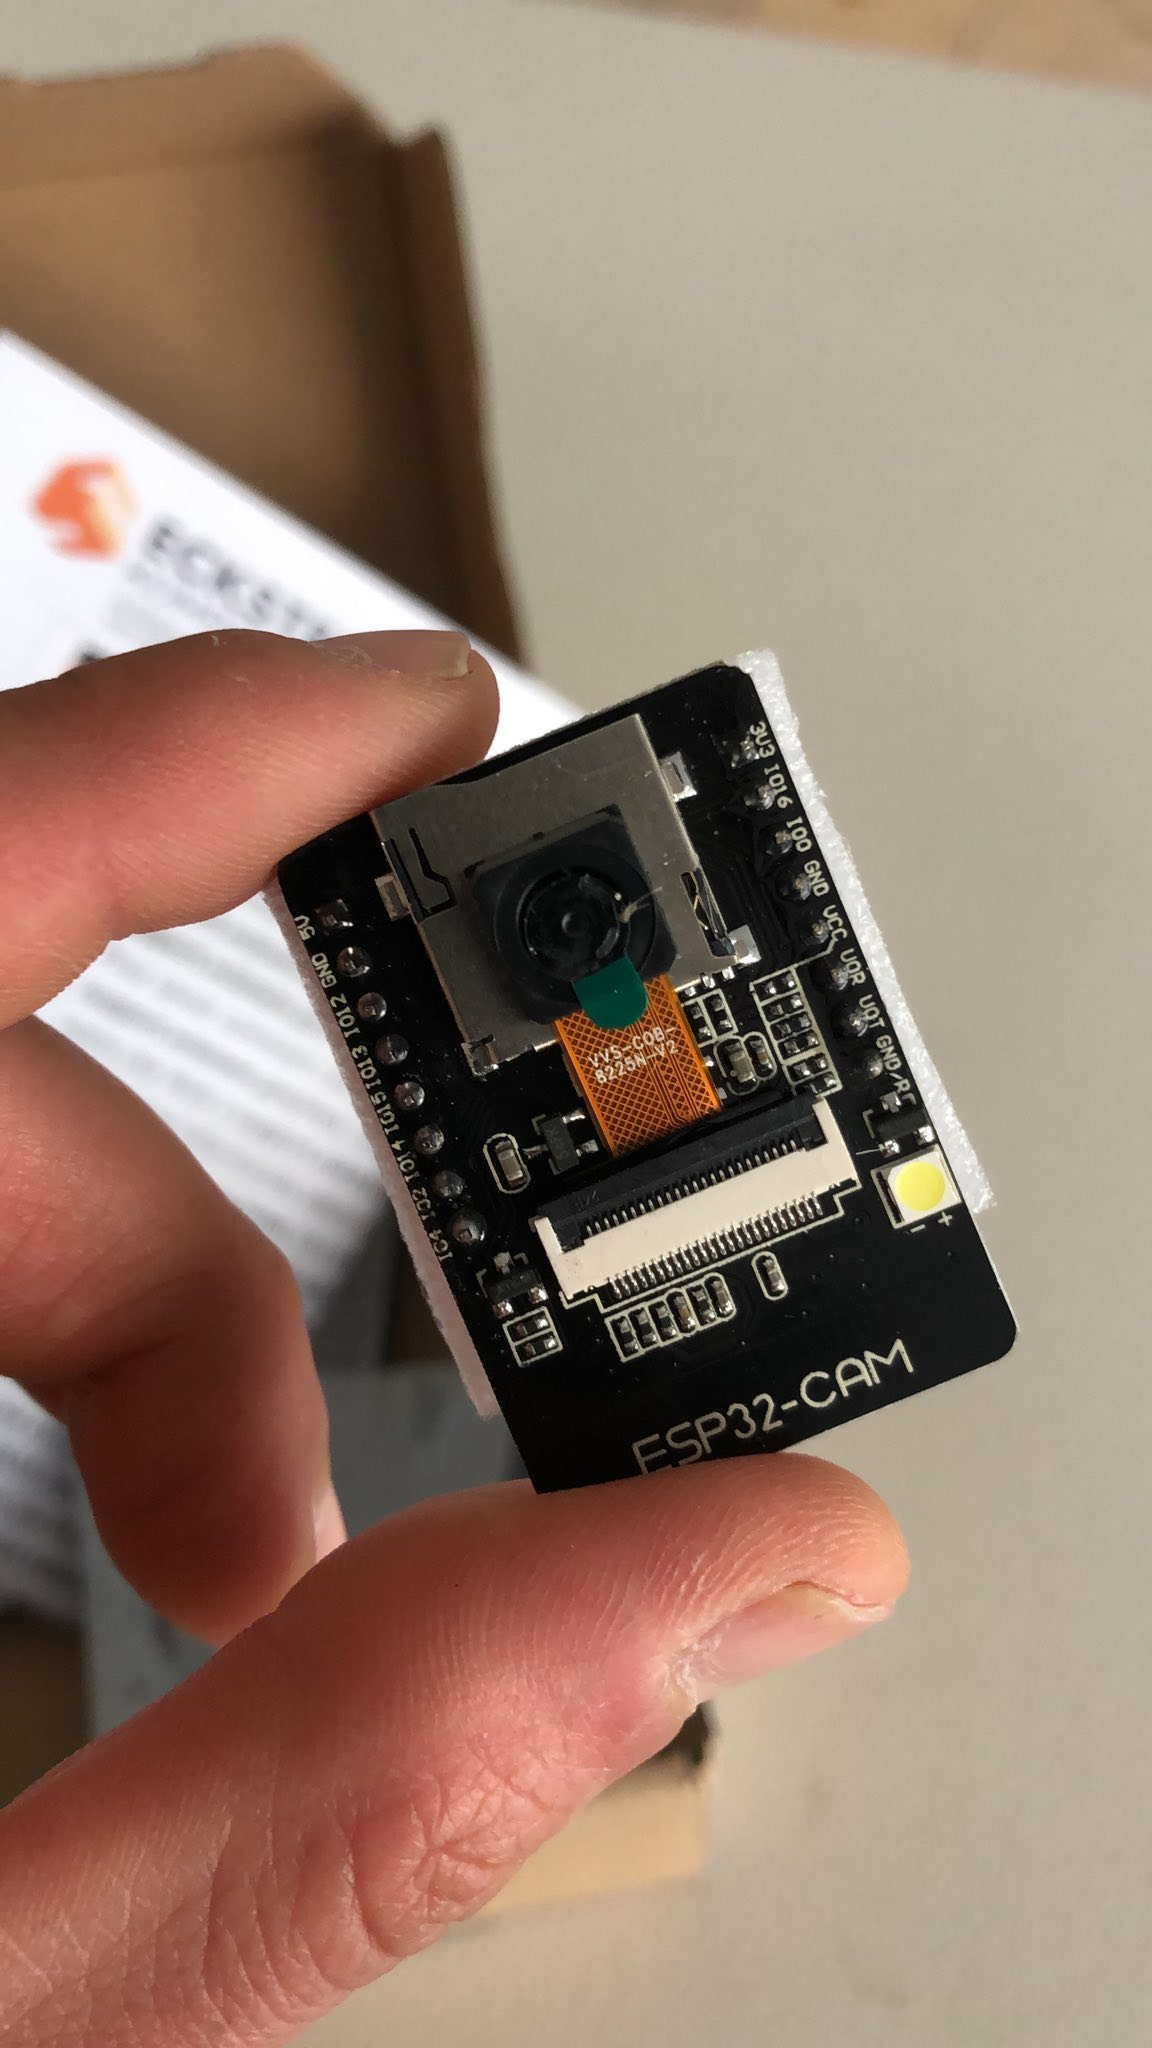
By looking at the agreed design, we have changed the design and decided to use a ESP32_CAM module as a micro controller.
Our 3 MCU-Wifi modules and the extra camera modules will be used for controlling lighting, relays and other external additions to the terrarium exposition and display.
We have designed the terrarium to make use of all of the available pins in the micro controller as well as having a uniquely design cover which will sit all the installations.
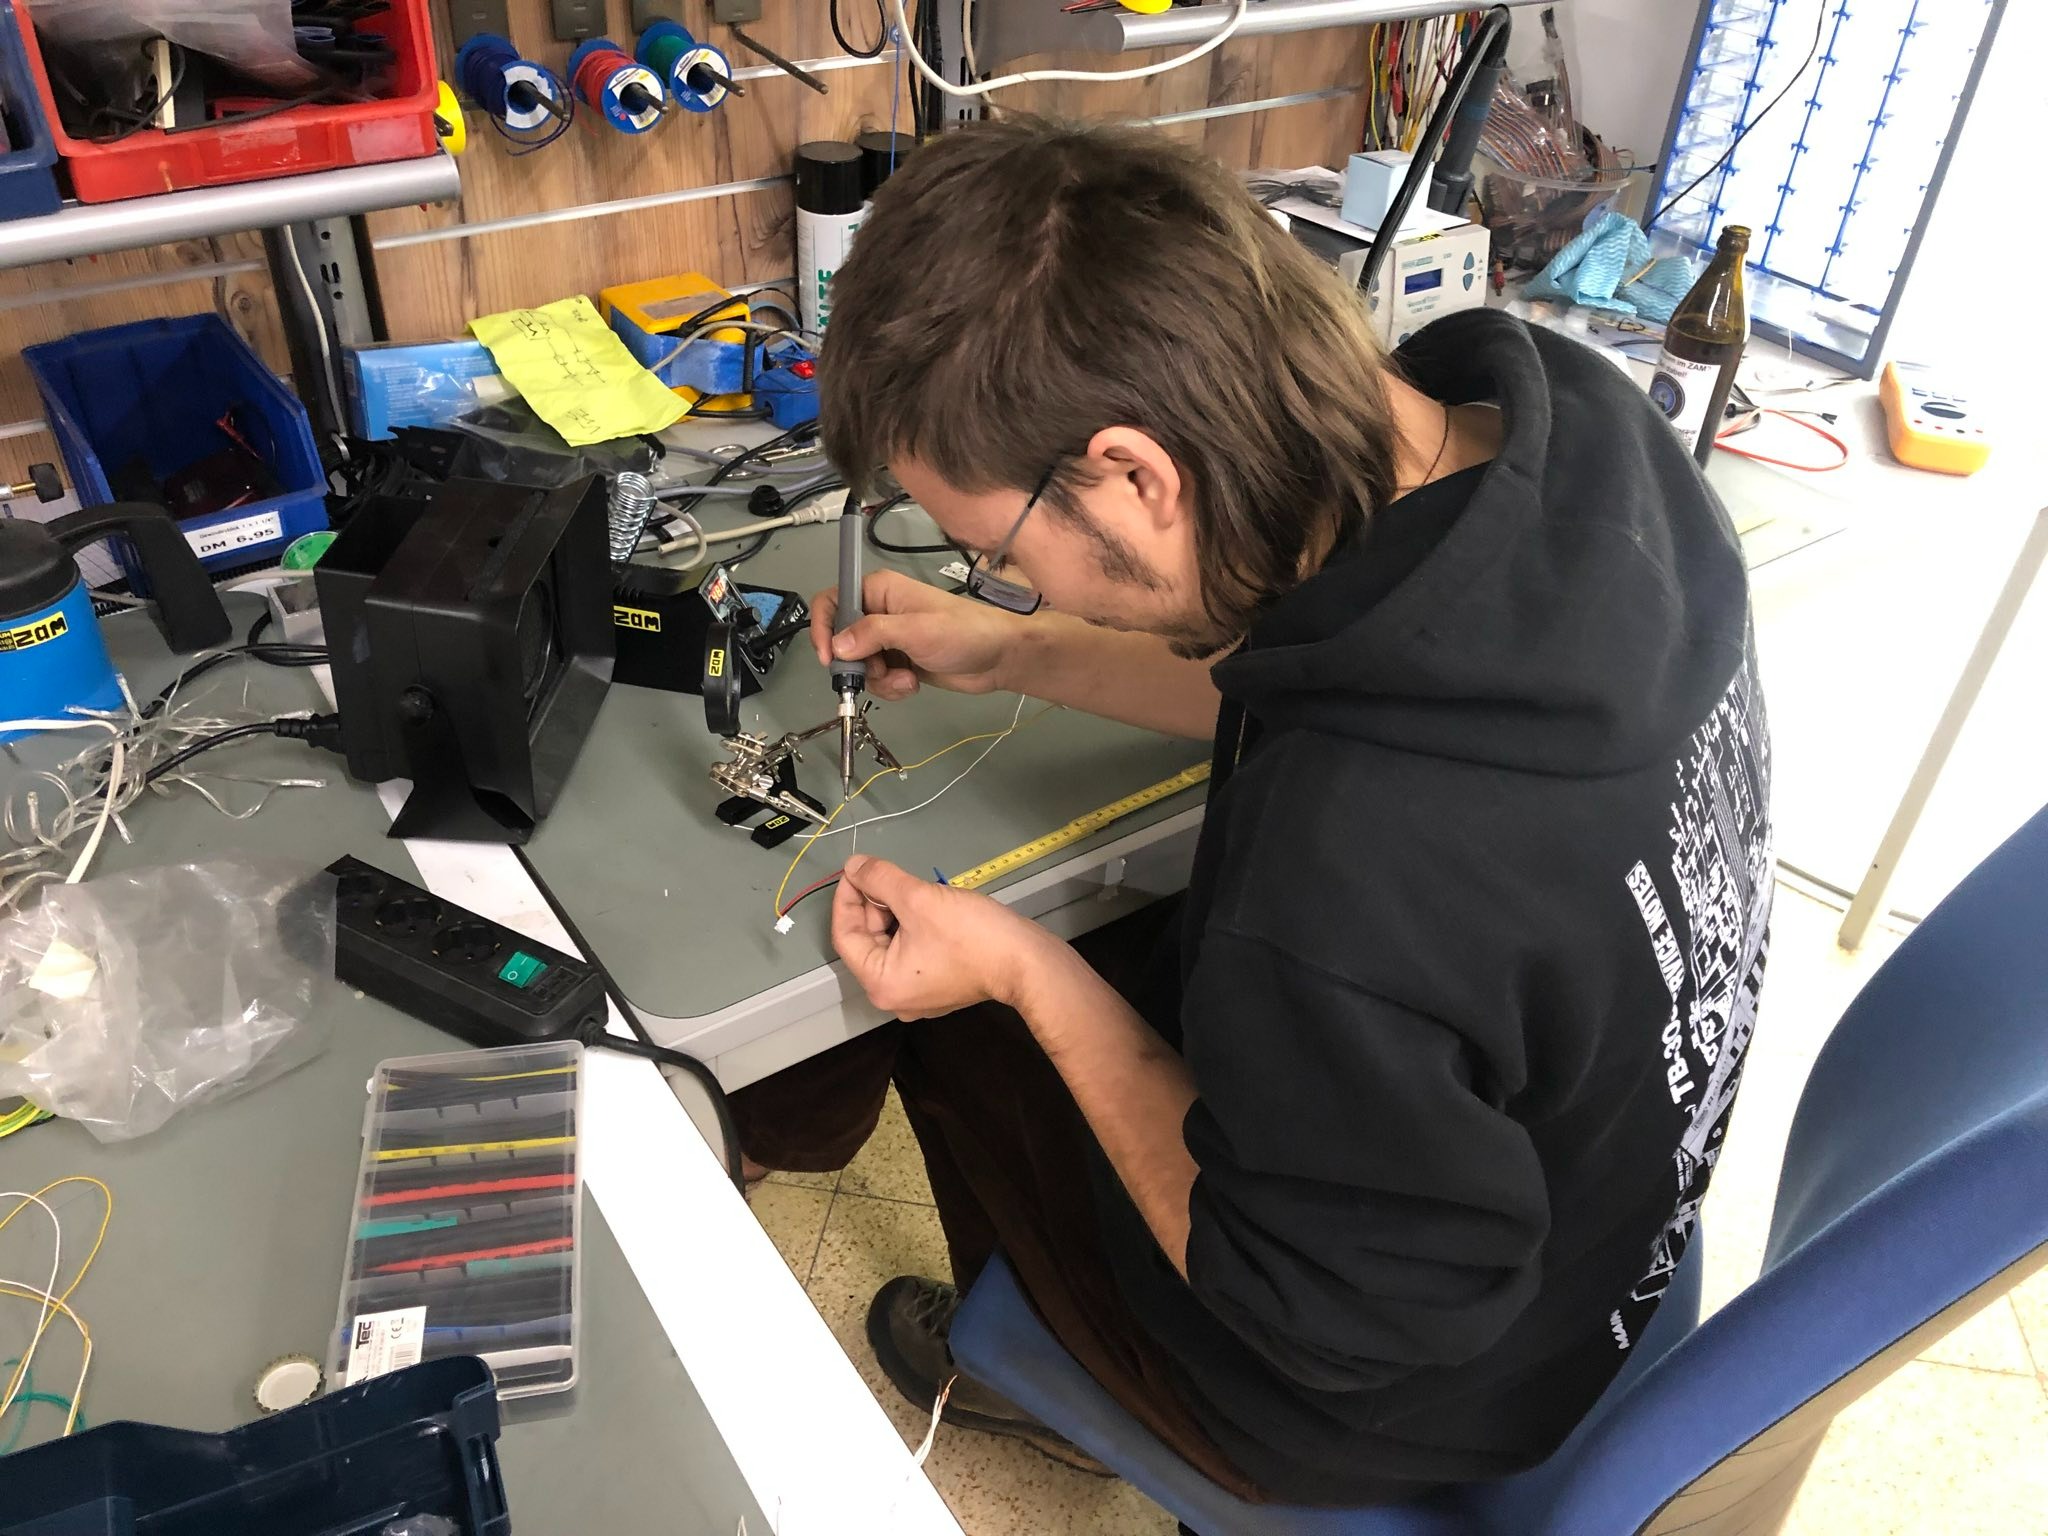
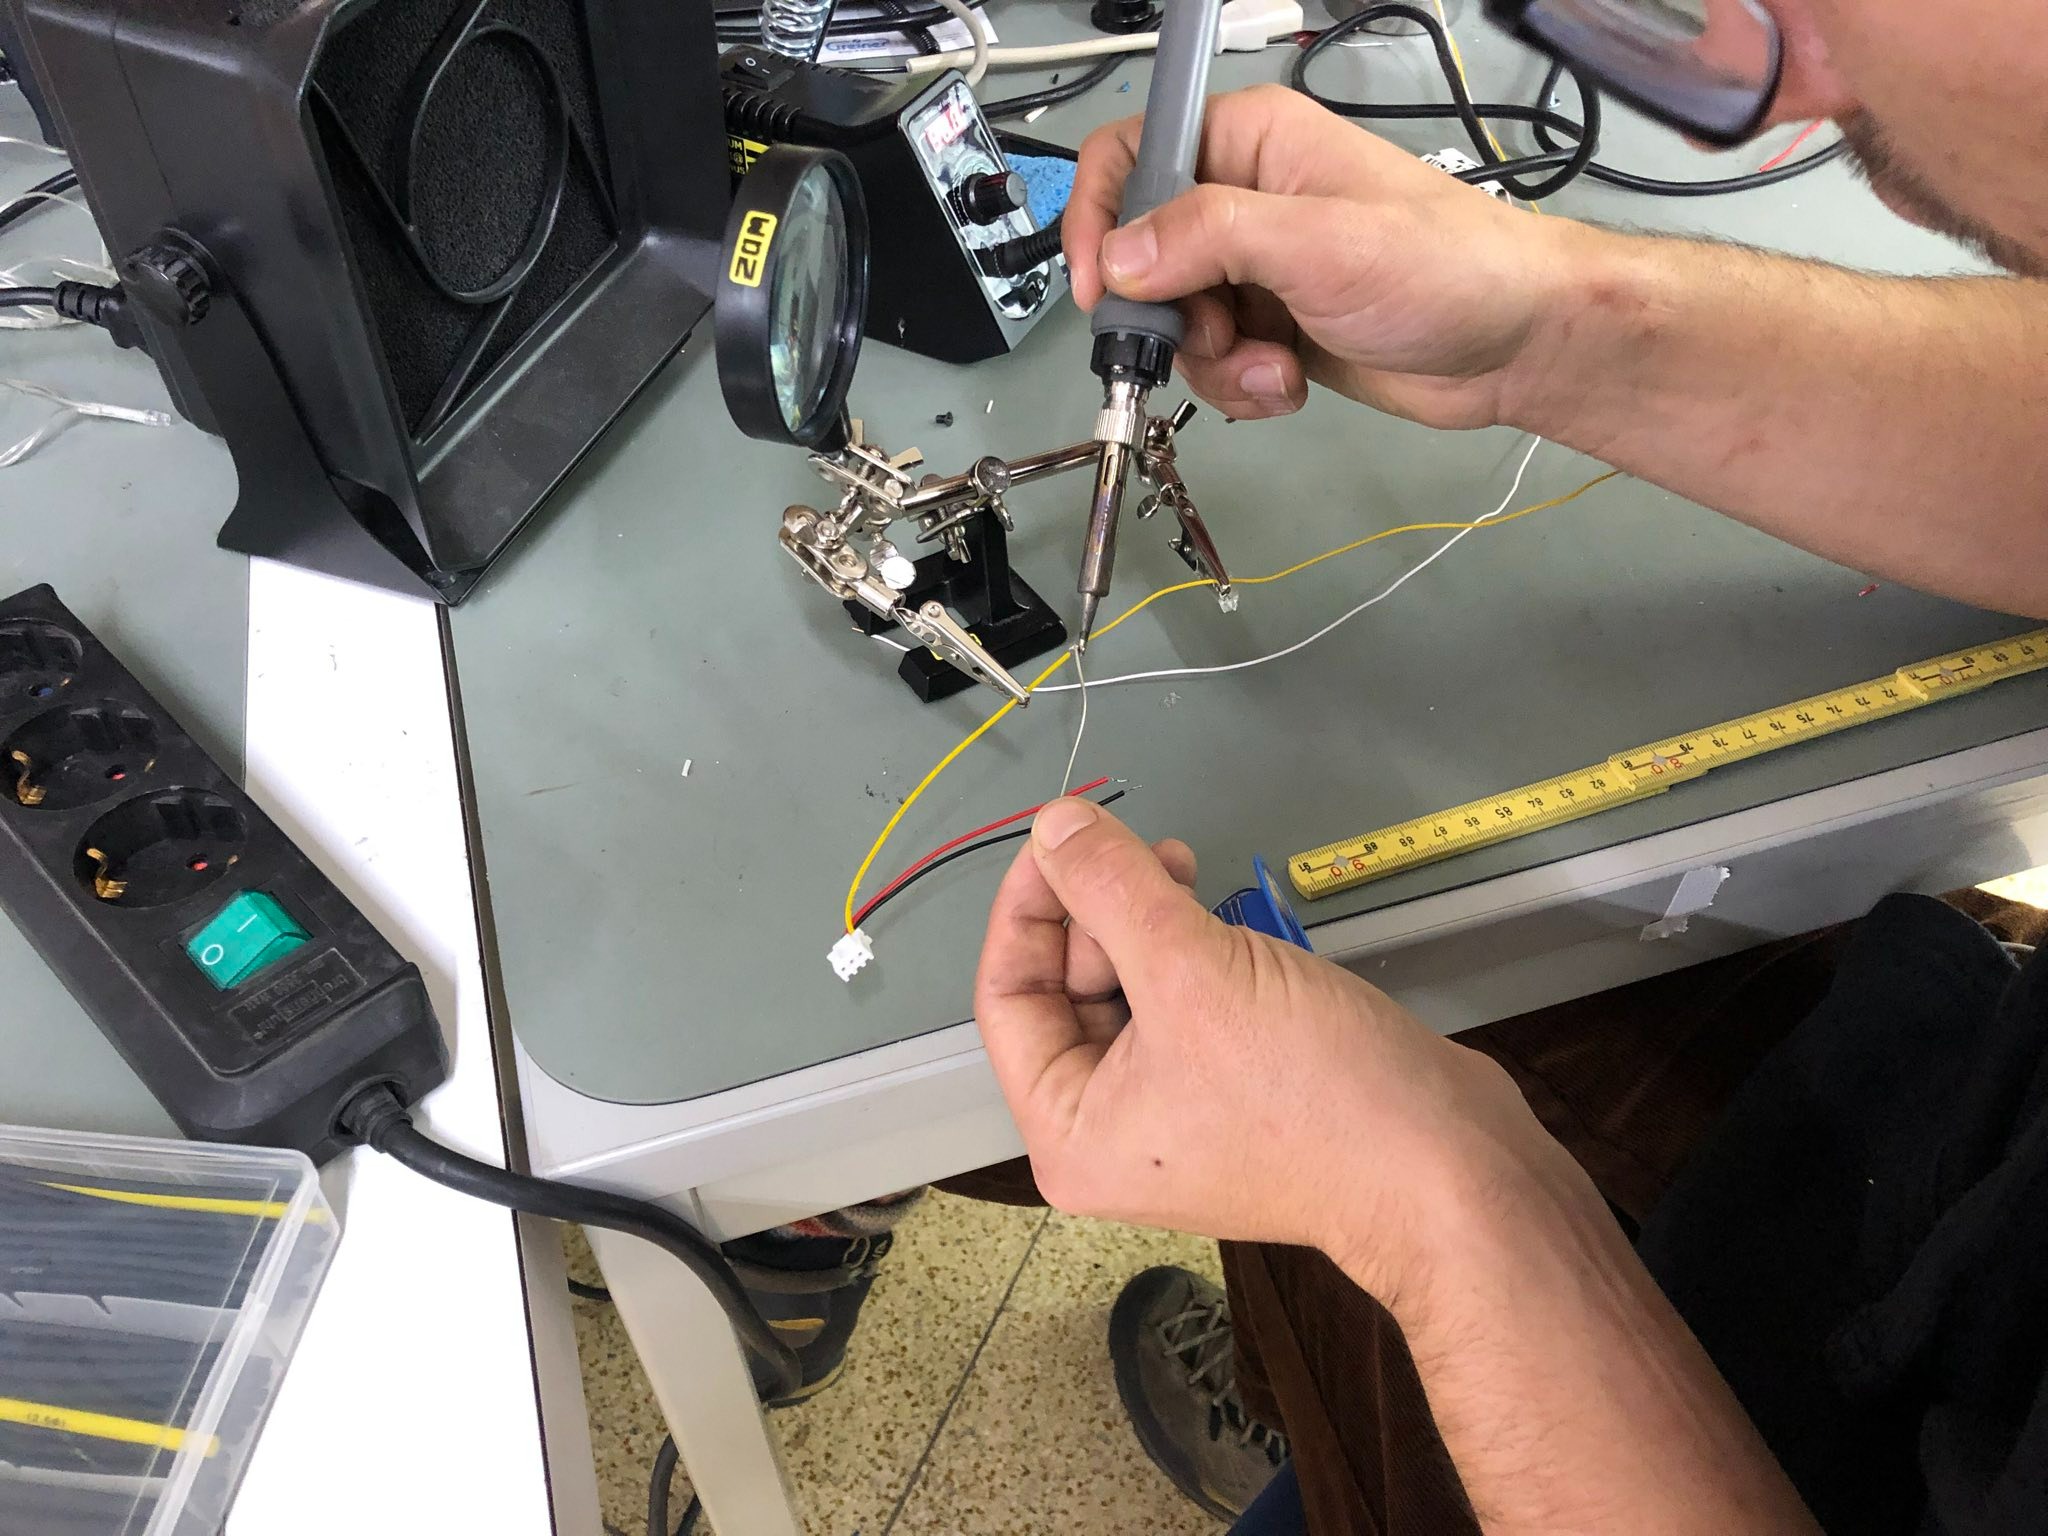
We have distributed the work and we begin to work...


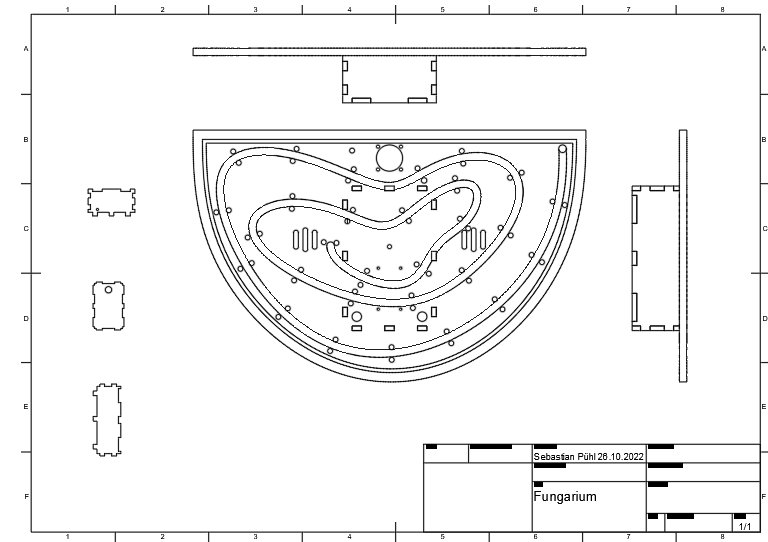
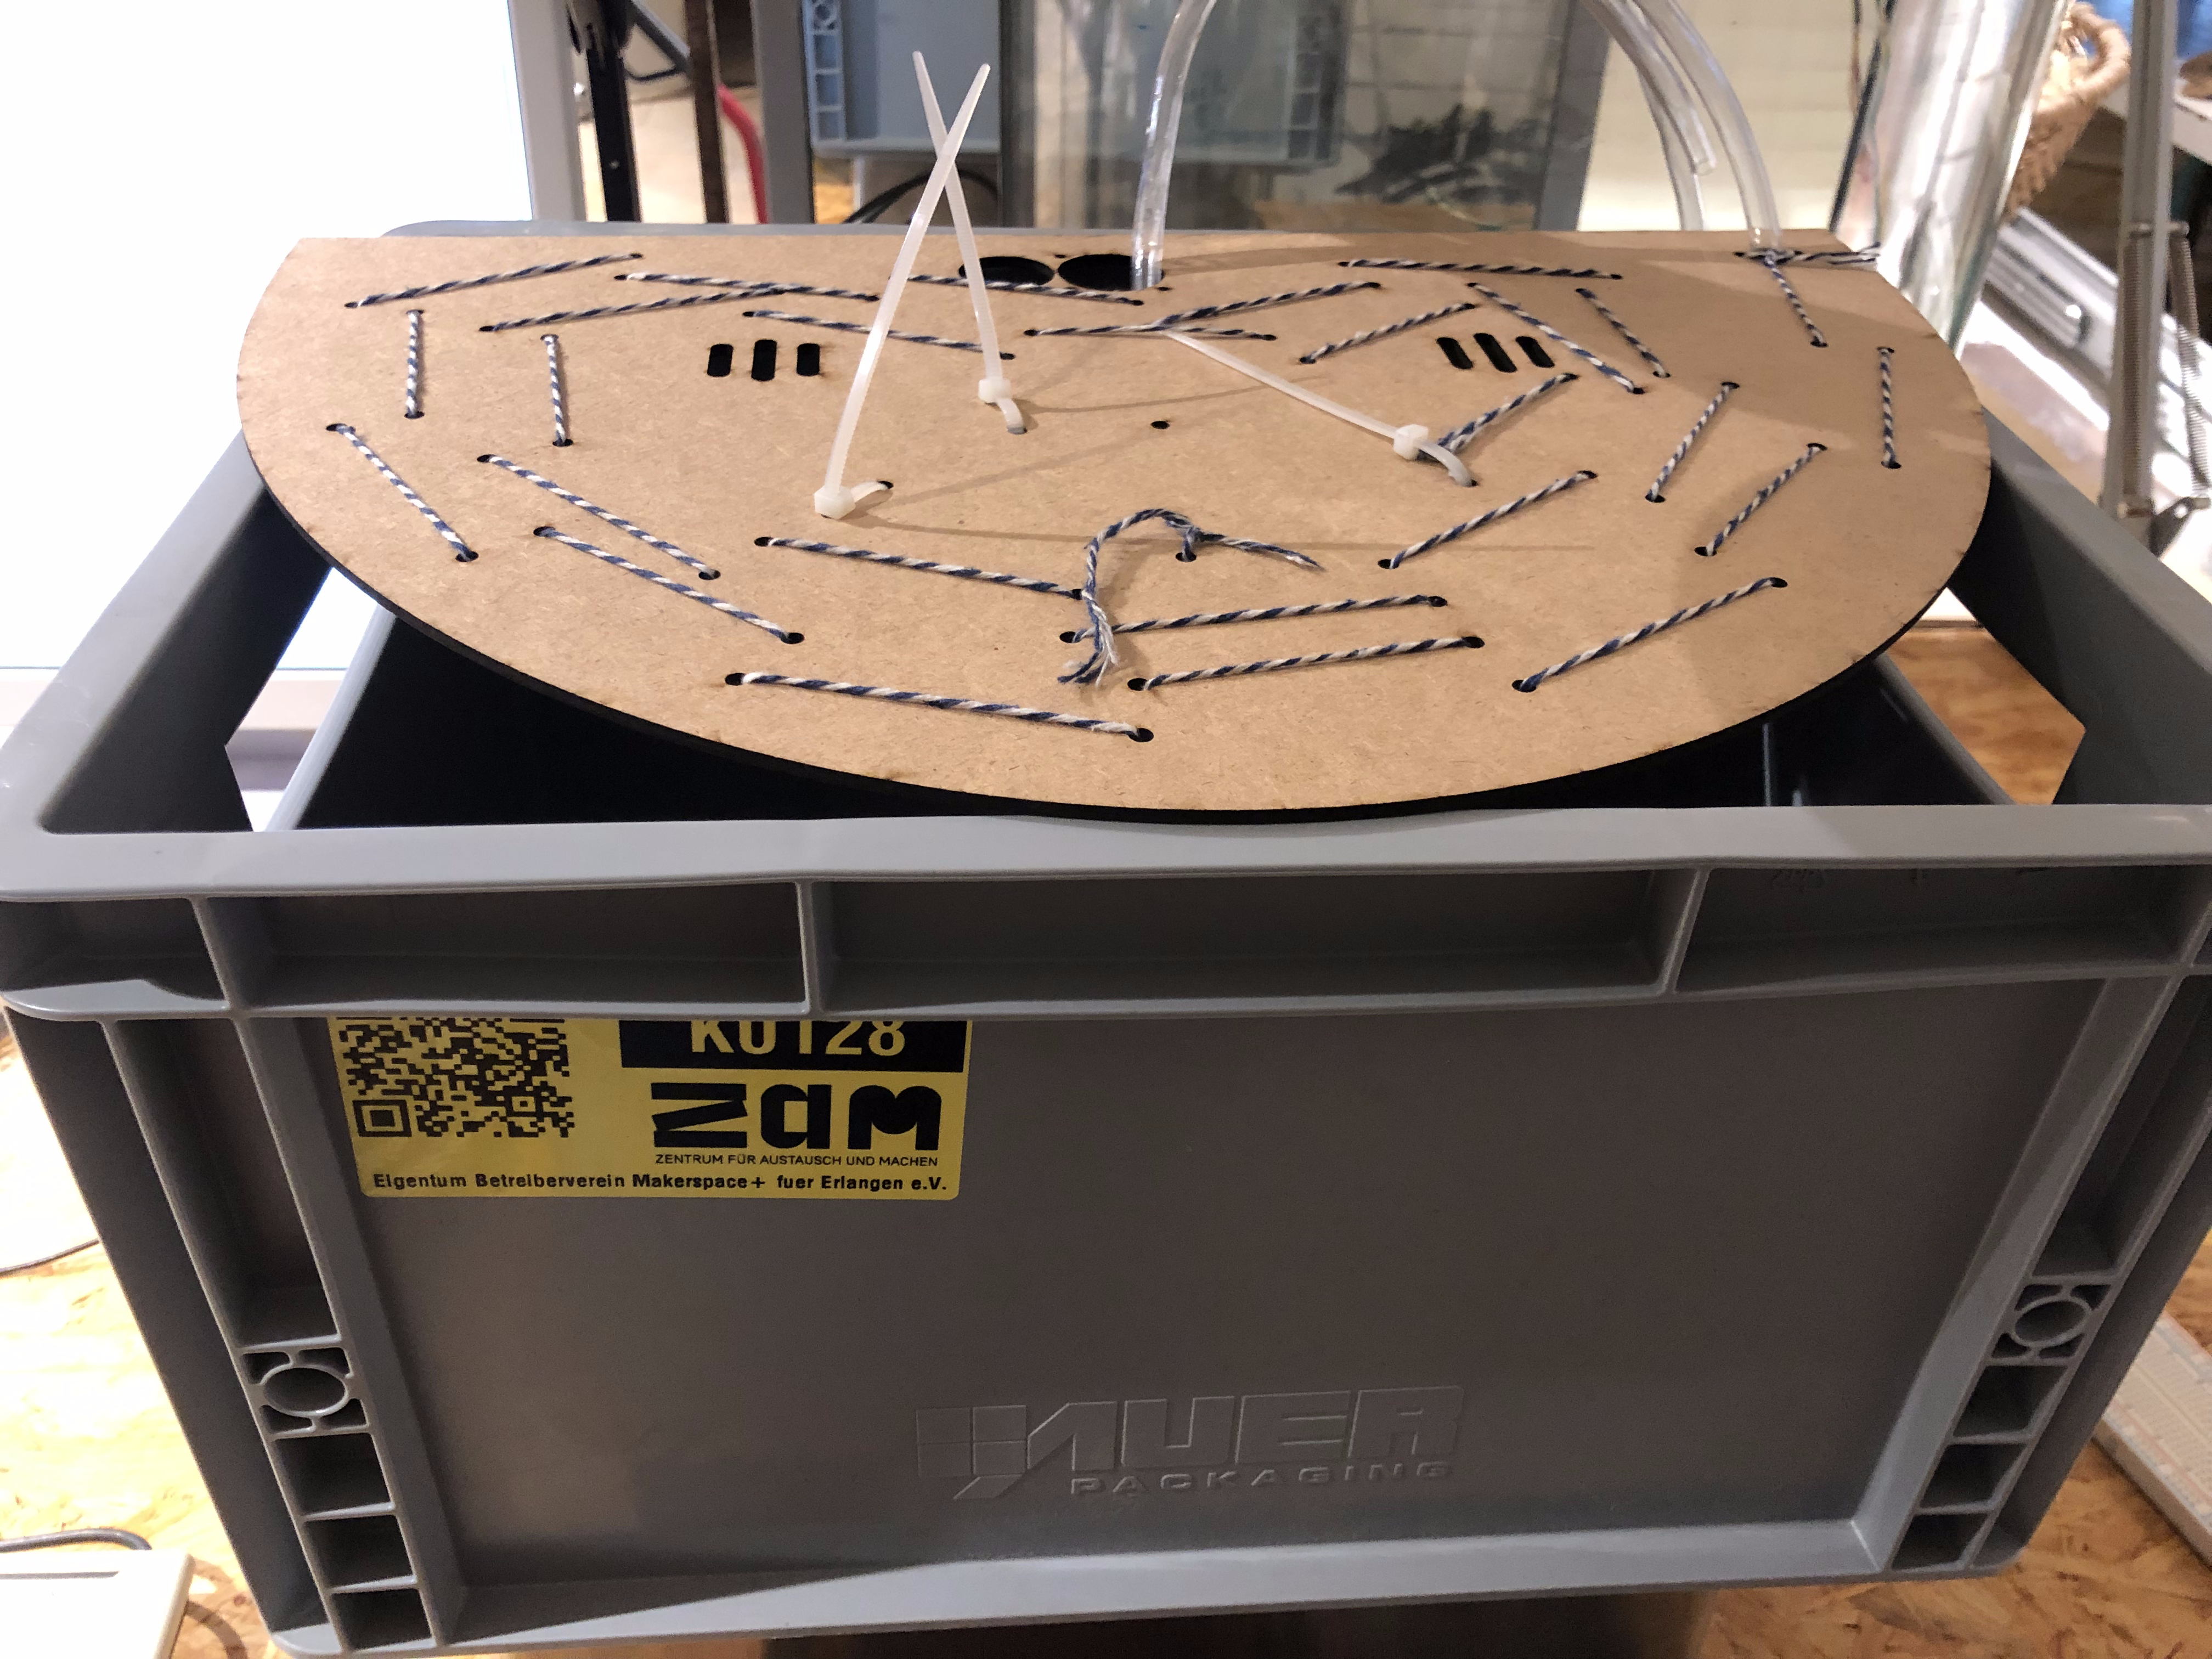
Design the lid for the terrarium
First, a CAD had to be created that met all the requirements such as all the holes for the fan, water supply, a mark for the hose that makes the water rain. Holes also had to be made for the cable ties that hold the hose. A box for the electrical components was also created. Ventilation slits and passive cooling were of course also included
Update for 22/11/2022
So much has been going on on the last 3 weeks.
- The full list of controllers is here and ready to be assembled.
- We have a new place in ZAM
- We are currently developing software
We would like to try the first terrarium fully functional close to the end of year.
Not all pumps are the same
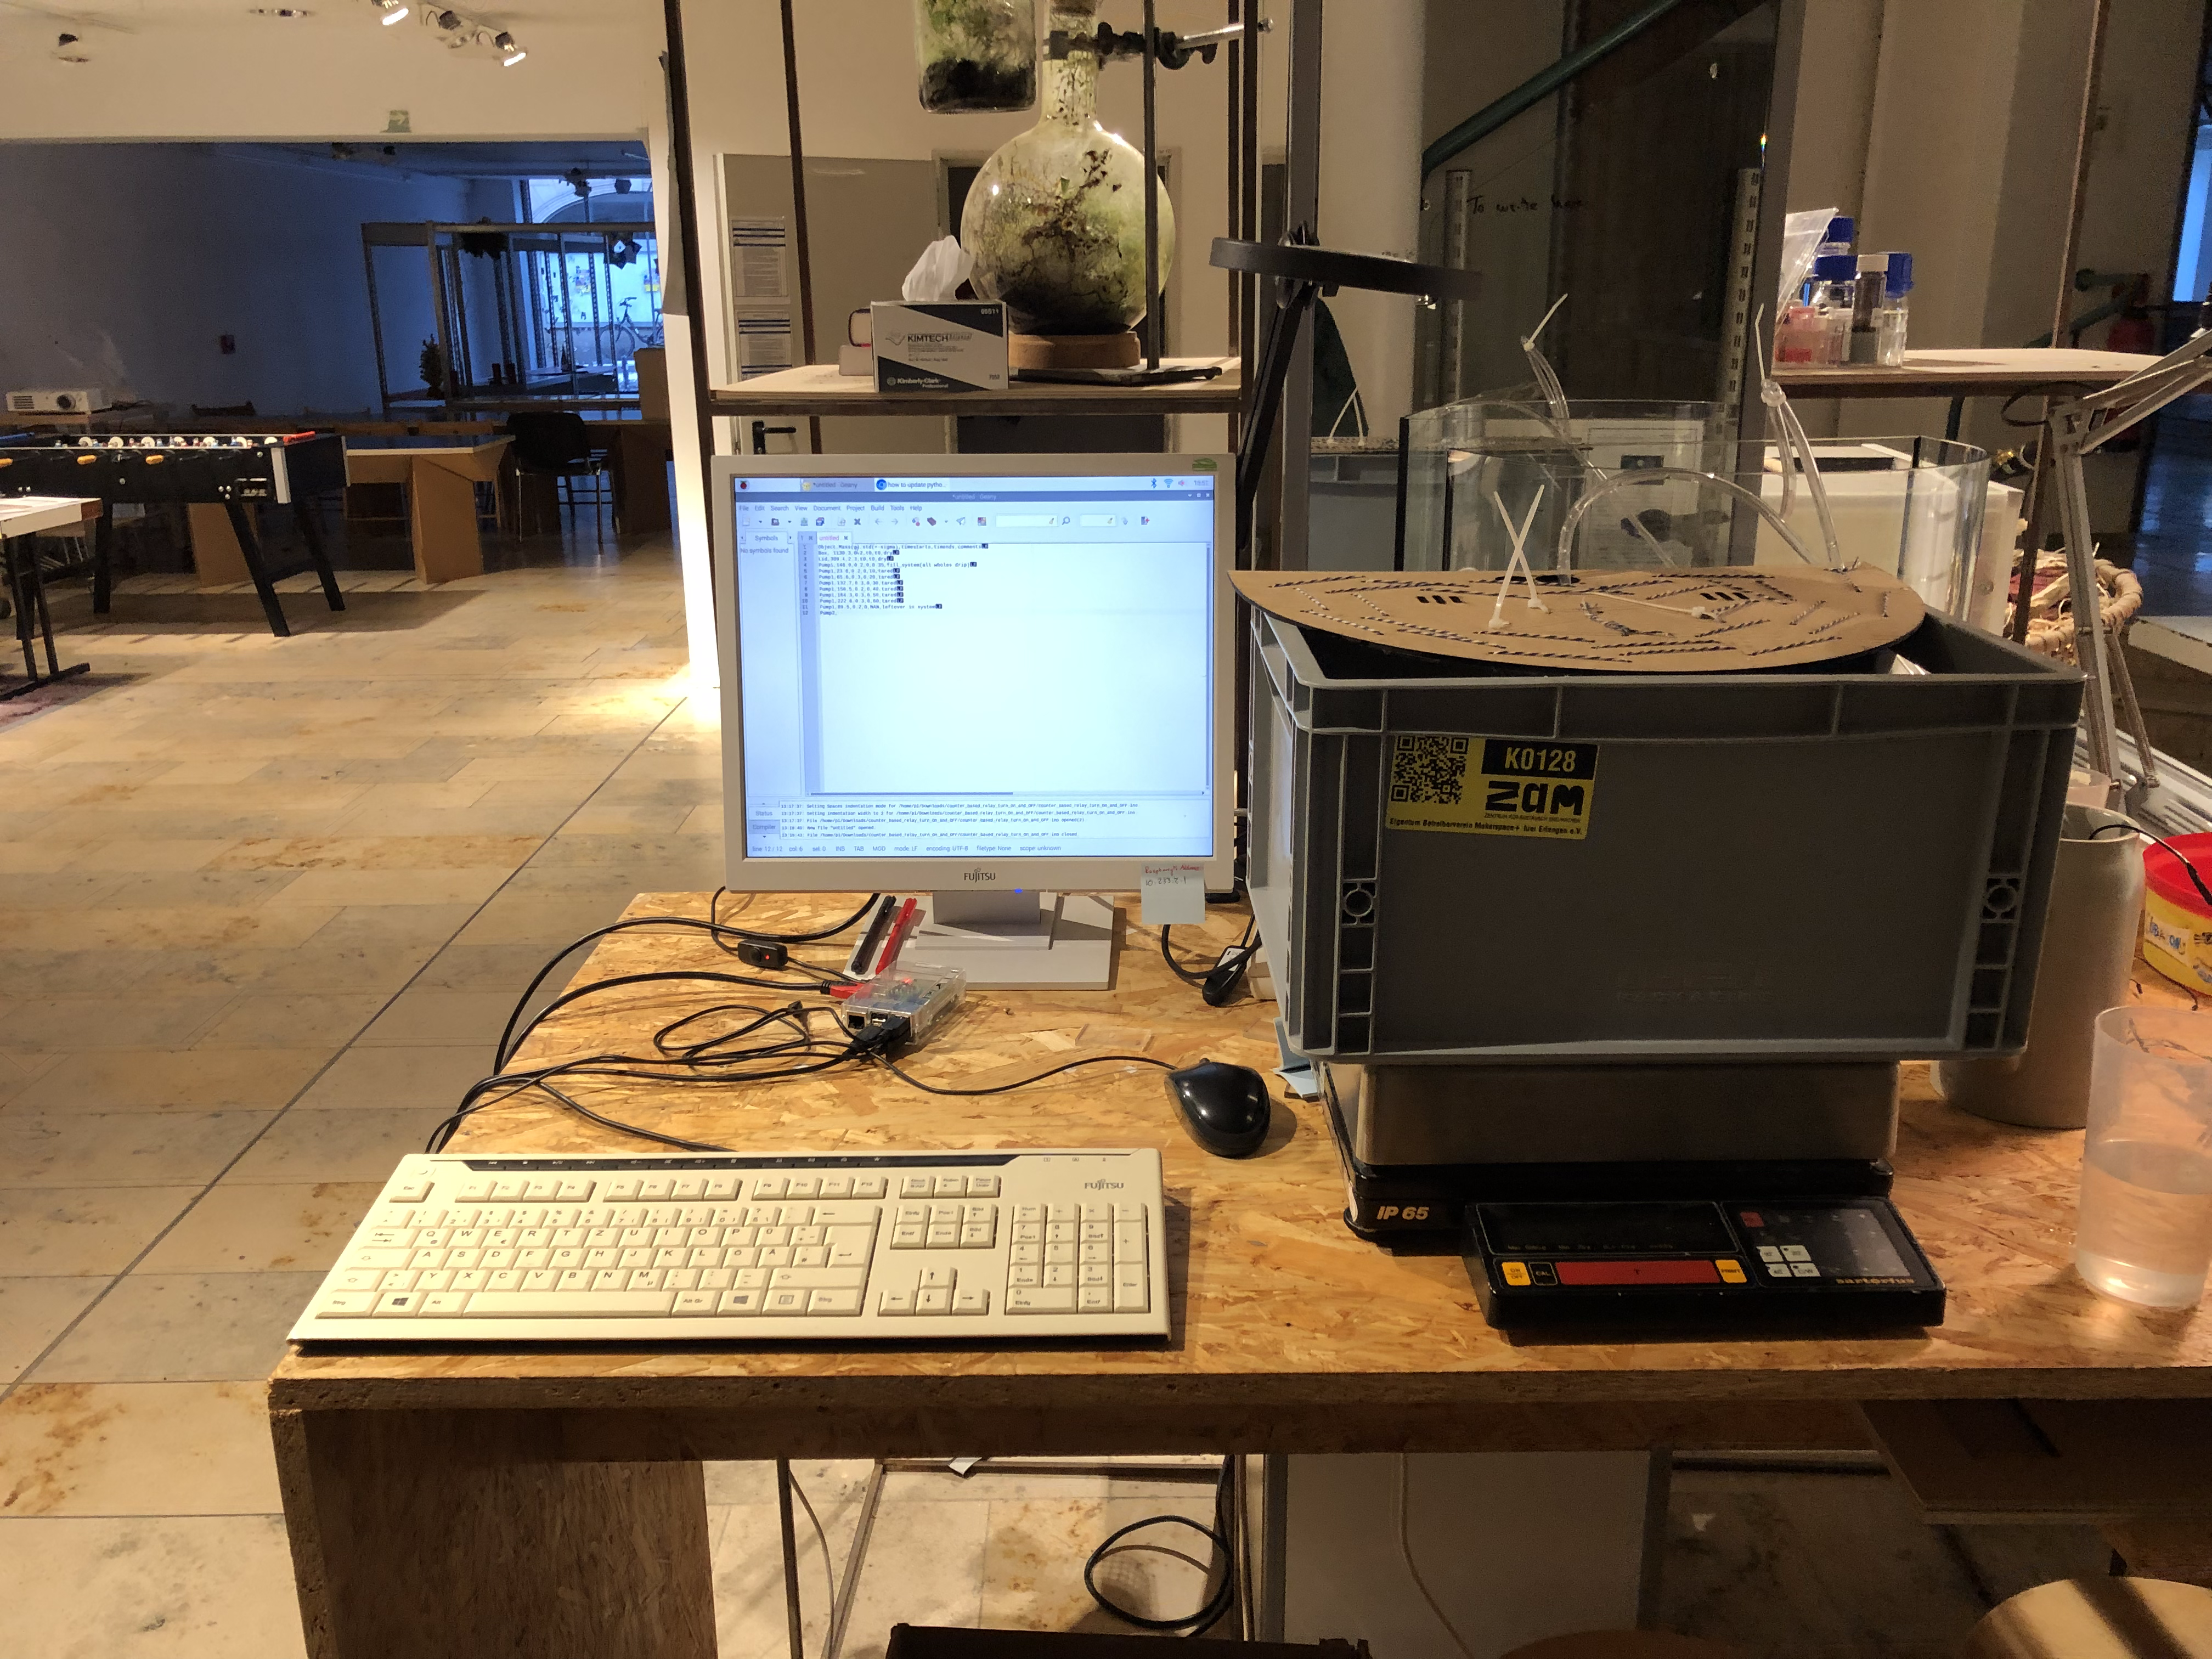
The aim of the experiment is to have all the terrariums under the same conditions. This means same amount of water. For this reason we looked at the performance of each pump. In this way, we could place them strategically and power them for a certain time to ensure the same volume is pumped.
The results of the experiments look like this.
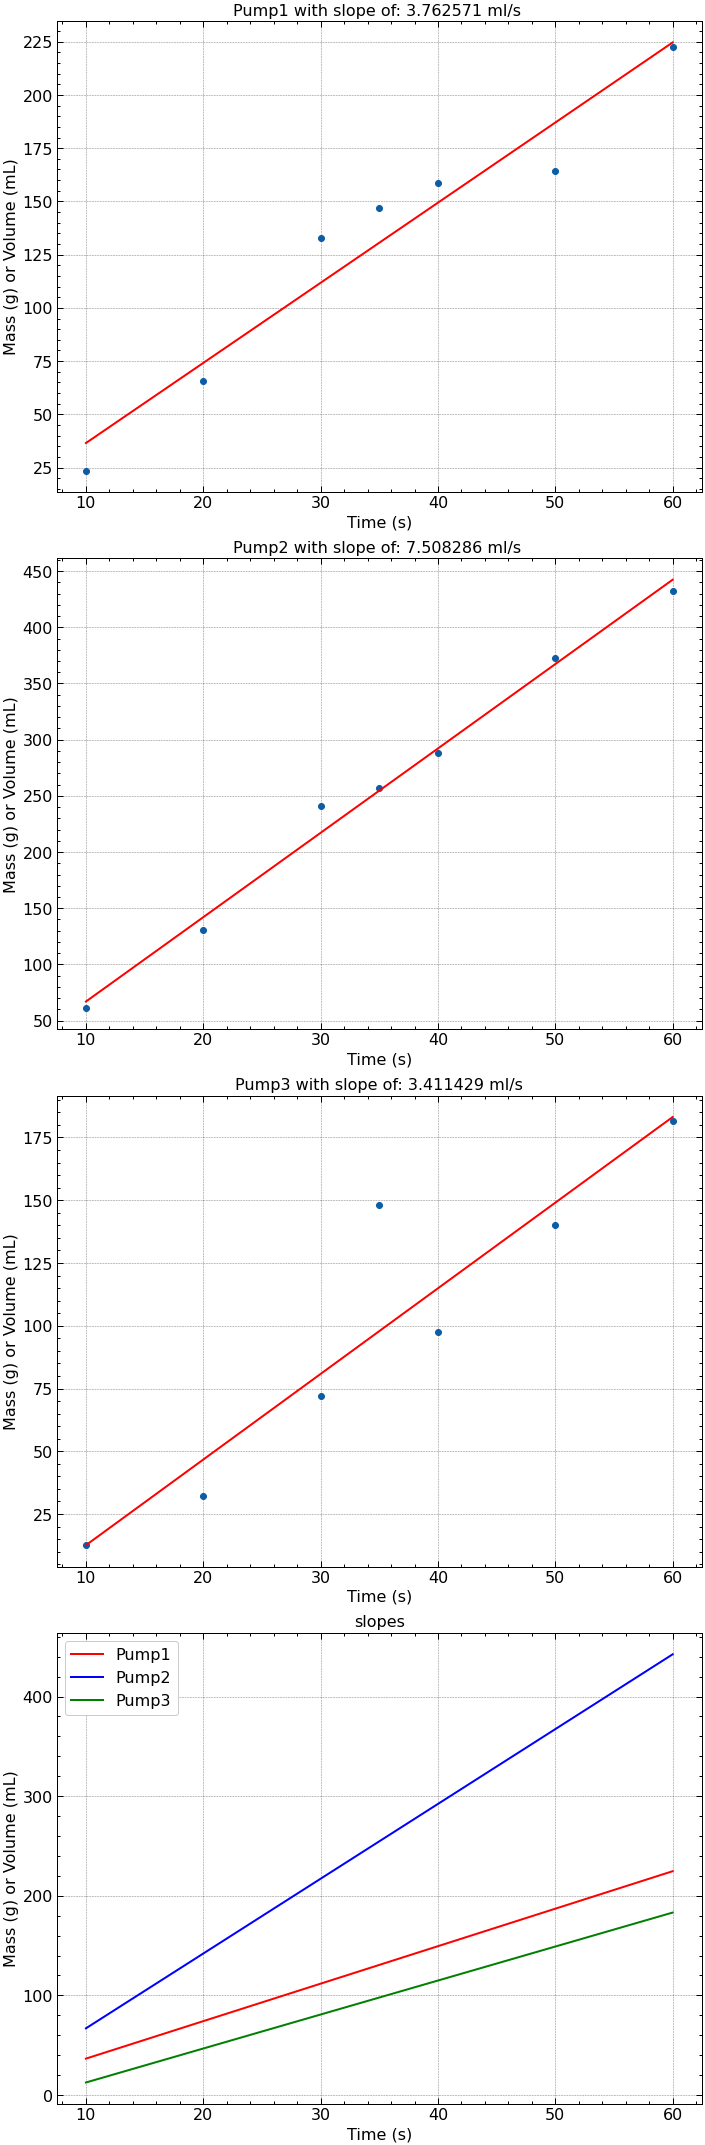
It seems that two pumps 1 & 3 are quite similar, while pump 2 is stronger.
This should be considered when placing the pumps in the final arrangement.
Designe of the PCB for the power distribution
To collect all the date power has to be brought to all the sensors, in our case 3,3V to every sensor, and that as acurrat as possible. than there are the pumps that need 5 V and the fan with his 12V.
Yes we could buy a power supply for all the different voltages, but why not make a PCB that does the work.
This is the final
PCB-Schematic 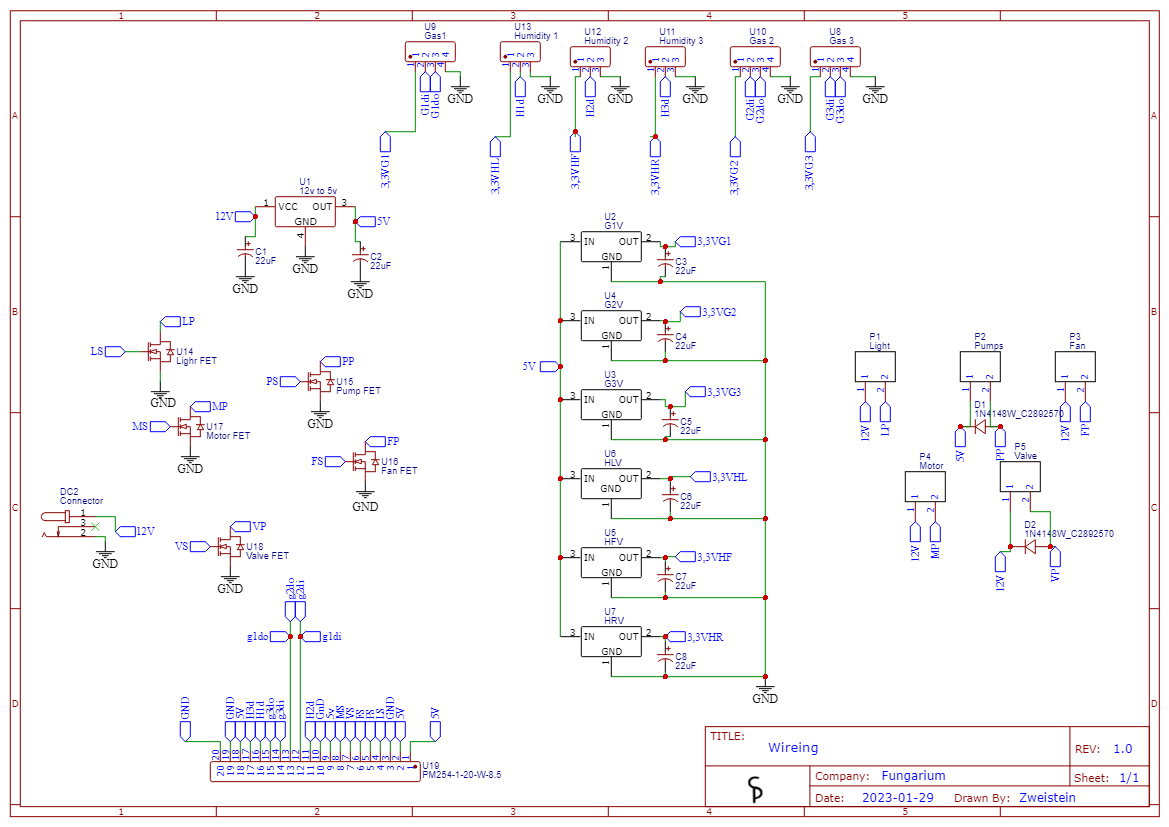

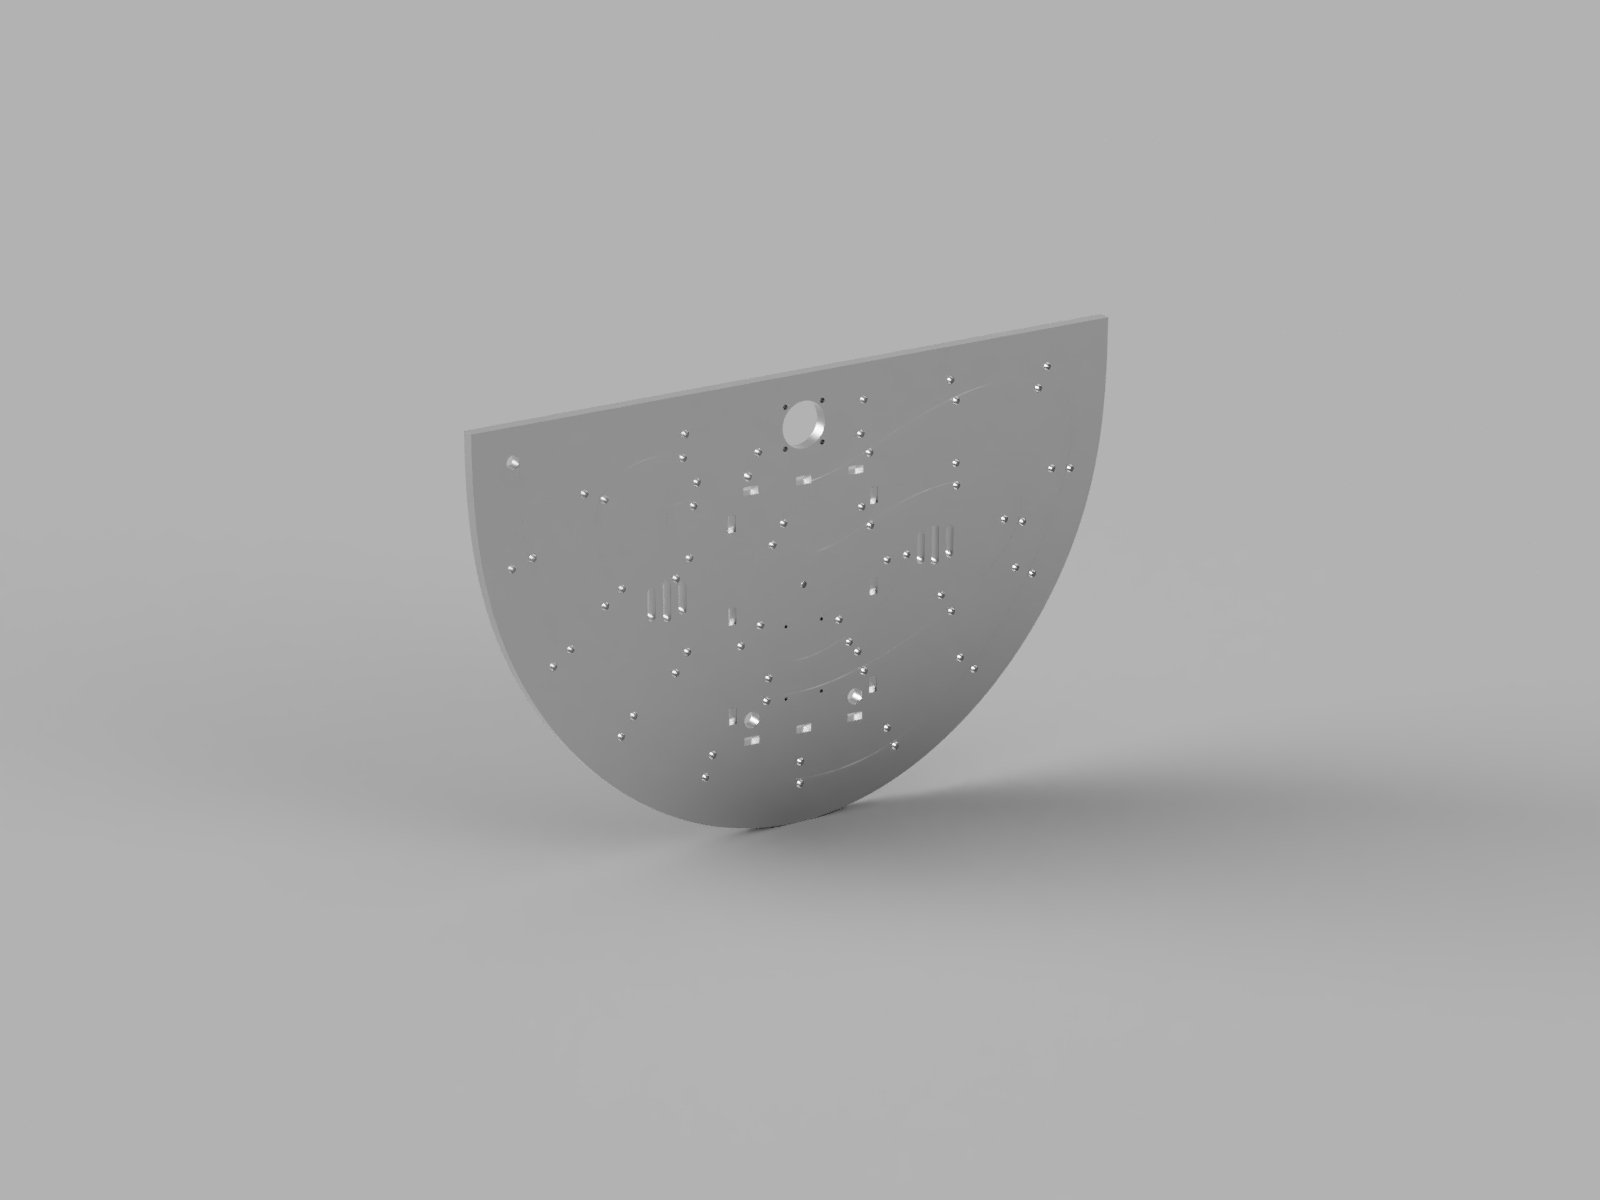
And the 3d Rendering
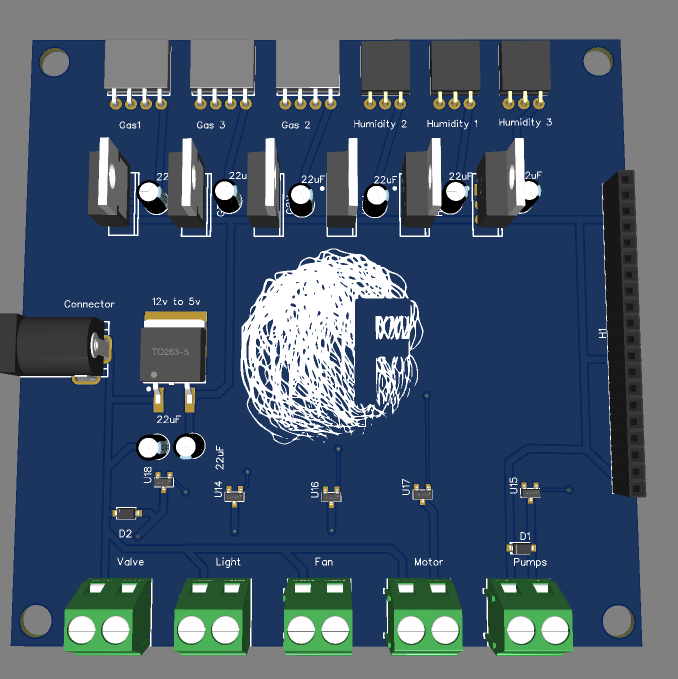
And a real Foto
falls das jemand sieht könnte bitte jemand das bild drehen und dann diesen Text löschen
Hey, I want to participate by this project Sebastian
Great Sebastian, welcome!
Nice tutorial https://randomnerdtutorials.com/esp32-esp8266-plot-chart-web-server/
No comments to display
No comments to display